FTSE Technical Highlights:
- FTSE broke 7600/550 support on Monday
- Old support becomes new resistance
- Path of least resistance remains lower
For longer-term trading ideas, forecasts, and a library of educational content, check out the DailyFX Trading Guides.
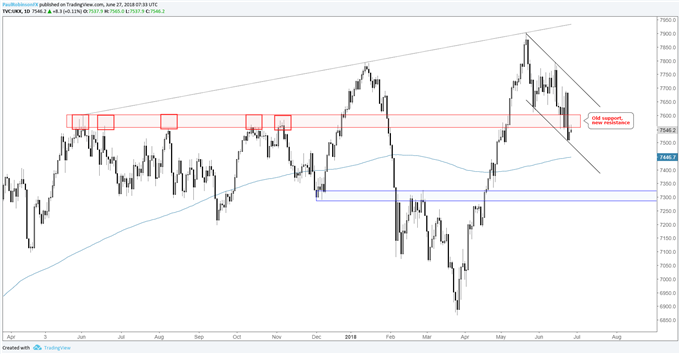
On Monday, the FTSE broke through the 7600/550 support zone that kept the market buoyed on a couple of attempts to break down last week. This has the UK index following along with a pair of other key markets – DAX and S&P 500 – that also broke below their own important levels of support in recent days. Overall, global equities are in danger of rolling further downhill.
With the FTSE trading right around the bottom of support, if we see a turn lower very soon (like today), the next level to look to, or in this case moving average, is the 200-day MA around the 7446-mark. As far as price levels are concerned, nothing meaningful arrives until down near 7300.
Even if the FTSE is to trade back above 7550/600 and stay there on a daily closing basis, the near-term trend off the high remains marked by lower-lows and lower-highs, suggesting it’s still vulnerable to more selling. With time perhaps the downward channeling price action works its way into a bull-flag, but some work is needed before that scenario can come into serious consideration.
Tactically speaking, the 7550/600 zone has appeal for would-be shorts given not only the importance of the level, but its proximity for stop placement and potential reward. We had a similar situation in the DAX last week, with price breaking support on Thursday, then slightly bouncing back into it on Friday (and then rolling over this week). Perhaps the FTSE will be as willing to cooperate.
Does volatile price action shake your confidence? Check out this guide for 4 ideas on how to Build Confidence in Trading.
FTSE Daily Chart (Broke Support)

For live weekly updates on the FTSE and other indices (& commodities), join me live on Tuesdays for ‘Indices and Commodities for the Active Trader’.
Forex & CFD Trader Resources
Whether you are a new or experienced trader, we have several resources available to help you; indicator for tracking trader sentiment, quarterly trading forecasts, analytical and educational webinars held daily, trading guides to help you improve trading performance, and one specifically for those who are new to forex.
---Written by Paul Robinson, Market Analyst
You can follow Paul on Twitter at @PaulRobinsonFX


