


U.S. Indices Technical Outlook:
- S&P 500 in bounce mode after testing lows, trend-lines to watch ahead
- Nasdaq 100 has a trend-line not too far away to pay attention to
- Dow Jones resistance test lies just ahead

Dow Jones, Nasdaq 100, S&P 500 Forecast for the Days Ahead
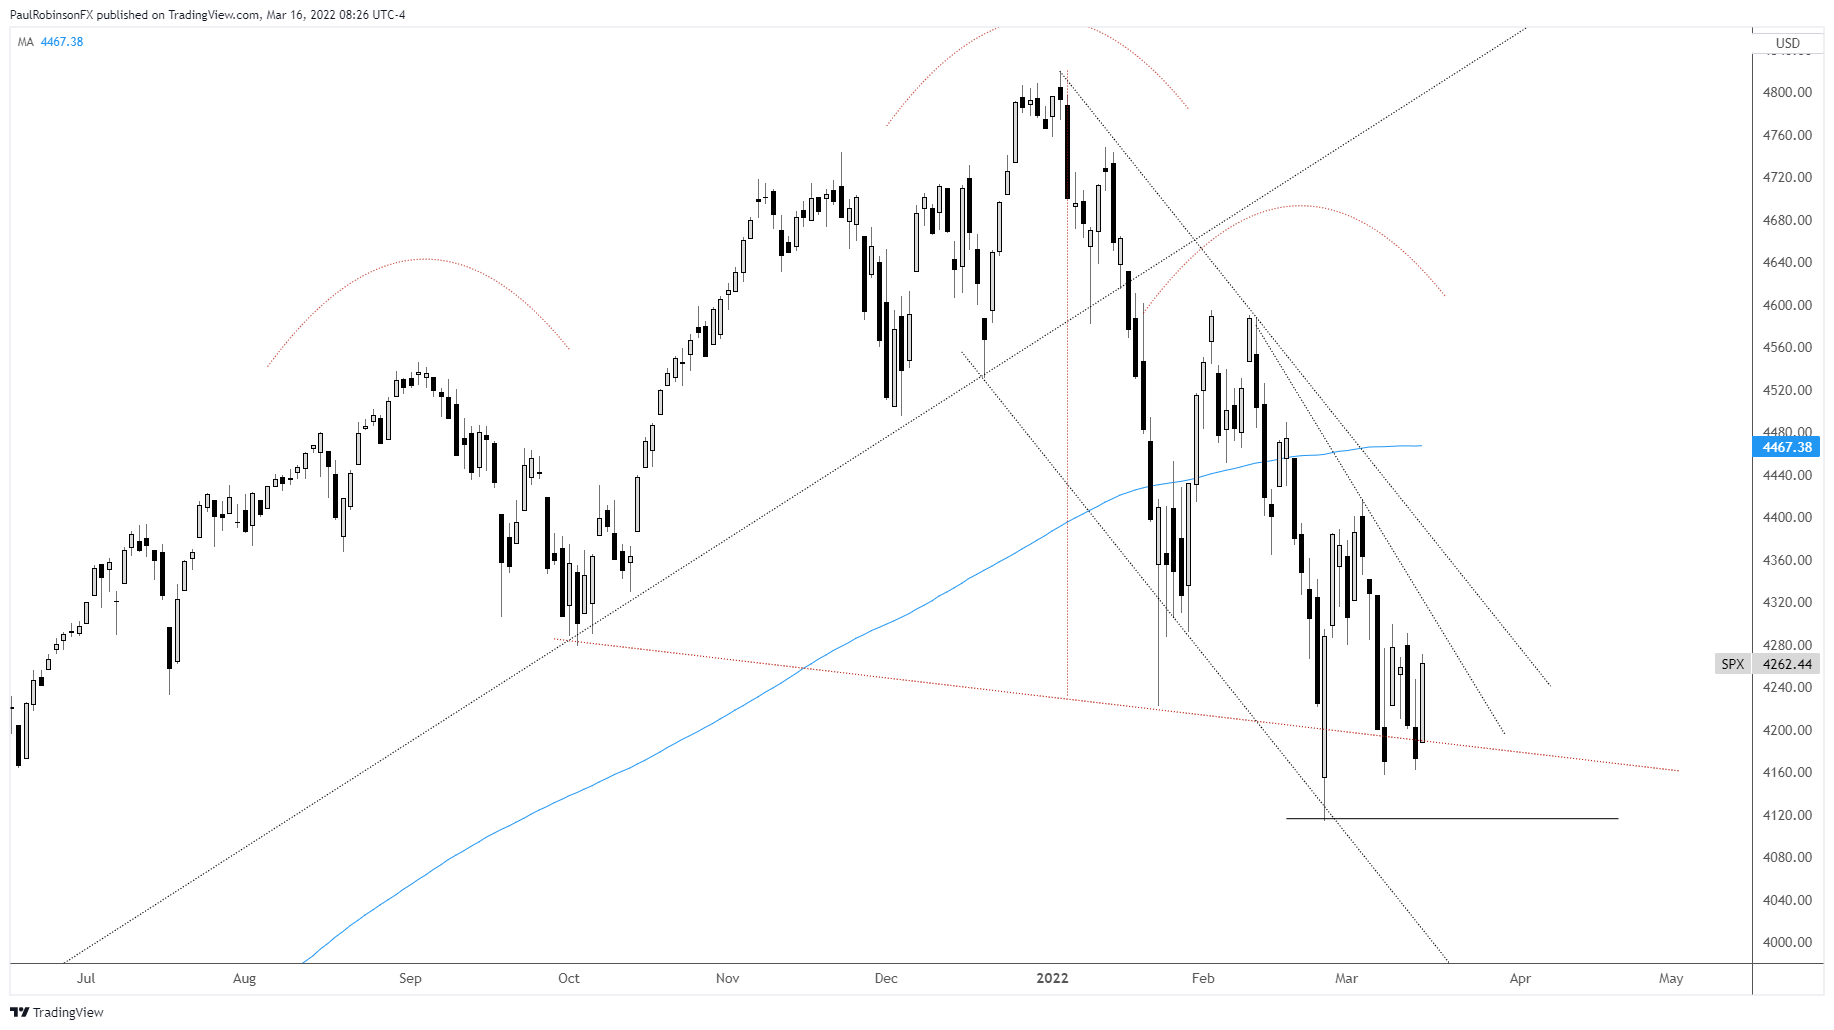
The S&P 500 is coming off a meaningful test of the Feb 24 gap and reversal day. Not long ago the U.S. markets were holding up relatively well compared to the more impacted European stock markets, but that glaring relative strength waned as we have seen the likes of the DAX bounce very strongly and the S&P 500 show only very modest strength.
The bounce is about to get its first test of resistance via a trend-line from early February. It is only a minor form of resistance, but could be a good test nevertheless of the power the market wants to show on the upside. Another trend-line from the record high lies just beyond the Feb line. This will also be an important test as to whether the market wants to continue to trend lower or not.
Generally speaking, the US markets never showed a real panicky low like the DAX and others global indices did, and so it has been difficult to gauge whether the market wants to really recover or if this is a bounce that will fail.
Other forces beyond what is happening in Ukraine may come to send US stocks lower. With European markets flying back over growing optimism on the Ukraine/Russia situation, the US is sluggish and may be signaling that other factors, such as rising inflation/rates/etc., could continue to be a major headwind for stock prices. Whatever the driver is I will continue to monitor price action. Right now it is not convincingly higher, and so a turn lower from resistance will be taken a potential cue to turn bearish again.
S&P 500 Daily Chart
The Nasdaq 100 is bouncing from around the Feb low after barely breaching it on Monday. The bounce is already finding itself near the Jan trend-line – will monitor price action at that juncture and the broader market. A solid close below 13020 could send the market strongly lower as the neckline of the head-and-shoulders pattern gets clearly taken out.
Nasdaq 100 Daily Chart

Nasdaq 100 Chart by TradingView
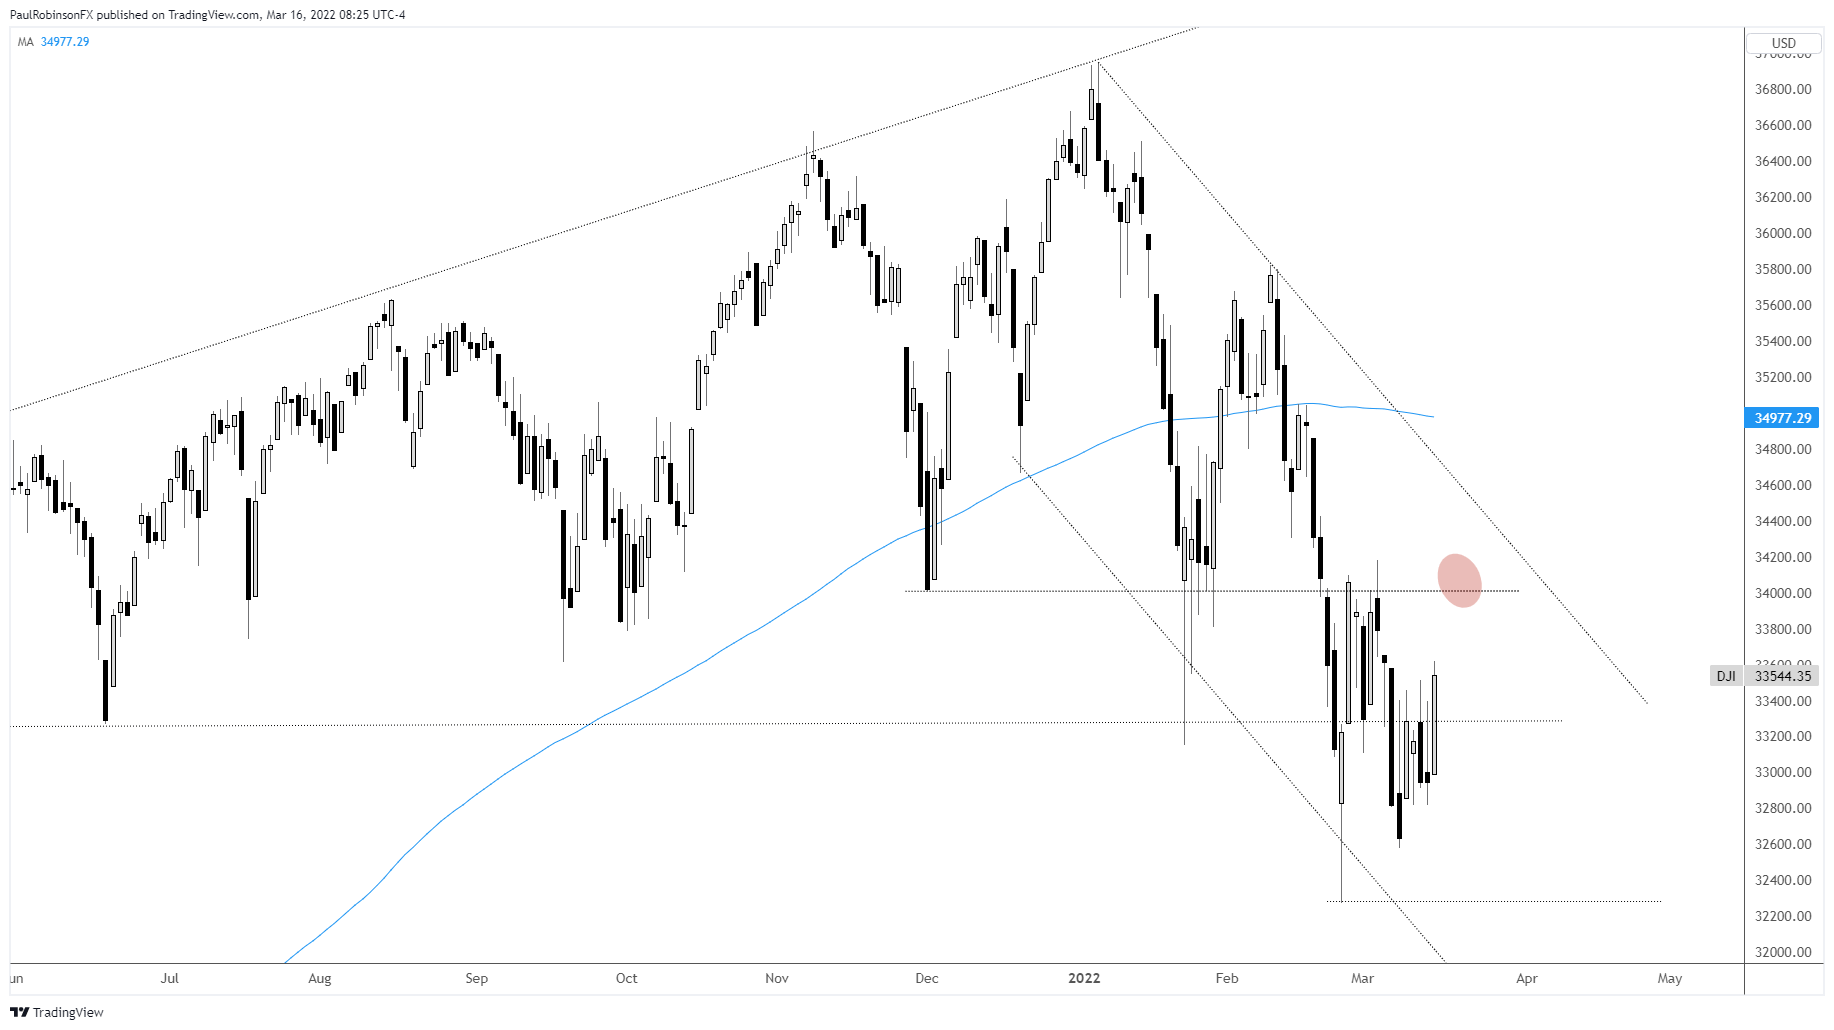
The Dow Jones could see be a battle with resistance around the 34k level. This is an area that began as meaningful back in early December and was support and resistance since. There is also a trend-line off the Jan high that could come into play just beyond horizontal resistance. Like with the other two indices a solid test of resistance could show what the market is made of.
Dow Jones Daily Chart
Dow Jones Chart by TradingView
Resources for Forex Traders
Whether you are a new or experienced trader, we have several resources available to help you; indicator for tracking trader sentiment, quarterly trading forecasts, analytical and educational webinars held daily, trading guides to help you improve trading performance, and one specifically for those who are new to forex.
---Written by Paul Robinson, Market Analyst
You can follow Paul on Twitter at @PaulRobinsonFX


