


U.S. Indices Technical Highlights:
- S&P 500 trading around October trend-line
- Dow Jones looking a bit more vulnerable
- Nasdaq 100 has support the closer it gets to 14k

S&P 500, Dow Jones & Nasdaq 100 Technical Analysis: Down but Not Yet Out
The following is a line from last week’s technical outlook for the S&P 500 and other indices: “Just because the market is extended doesn’t mean it needs to pull back, but risk is certainly becoming elevated that at least a minor pullback is nearing.”
Since then we have seen stocks weaken a bit, not unexpected. The sharpness of the decline has been a bit concerning, but with support not too far below there is still a fair shot that this isn’t much more than a minor correction within the context of a strong trend.
But it wouldn’t take much to change that outlook. General breadth has been deteriorating. One doesn’t need to look much further than the major indices to see this, though there are other signs such as TSLA showing serious weakness relative to the broader market and general breadth indicators lagging as new highs in the SPX are achieved. Once darling stocks are becoming fallen angels.
But looking at the indices, the small-cap index, Russell 2000, is trading at January levels and the 200-day MA is only a stone’s throw away, about 2.5% from here. The Dow Jones sold off yesterday over 2% for only the third time this year, putting it in position to have gained nothing over the last three months.
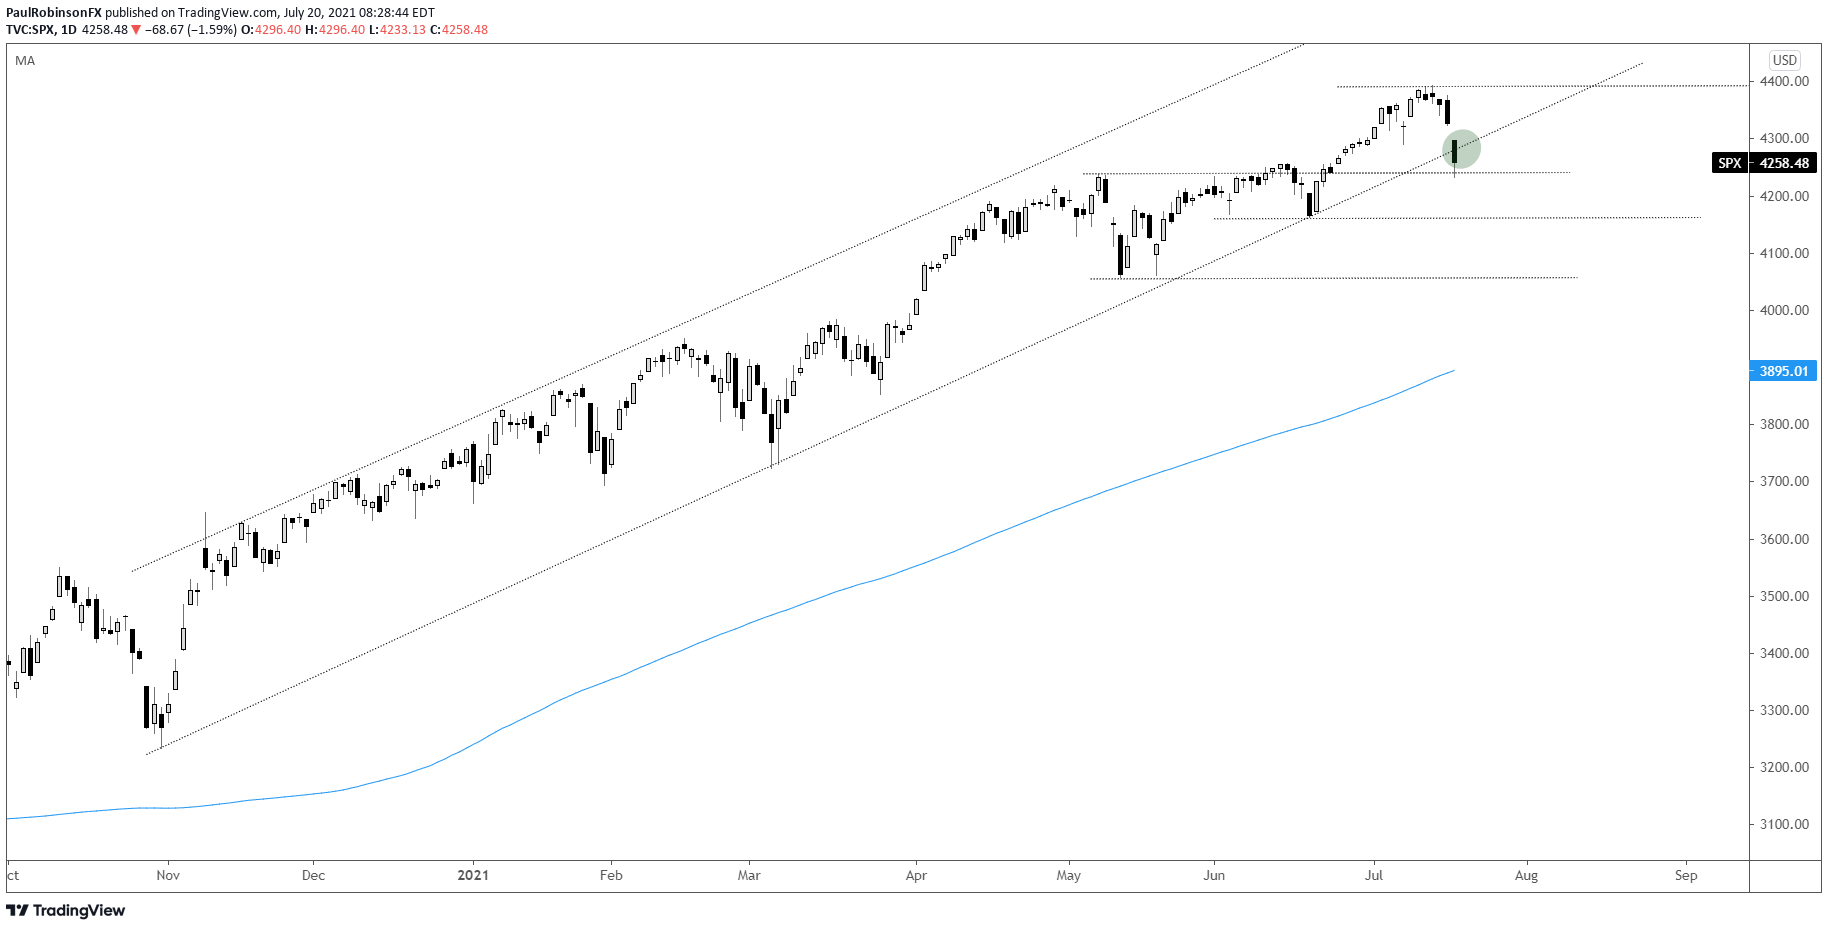
The S&P 500 is trading around the October trend-line, actually slightly below it. A turnaround here would keep it intact, but will need to do so very soon. Further weakness will have the line broken and lower levels in focus. Next up will be a swing level from last month at 4164 followed by the May low at 4056.
The Dow is looking at 33271 as the next level of support while the Nasdaq 100 has levels the closer it gets to 14k. A top-side trend-line running over from February clocks in around 14320 and then there is the spring highs around 14050.
The trend is turning and it will be important for the indices to hold onto support levels soon, else deteriorating market conditions will start to hold much deeper meaning.
S&P 500 Daily Chart
Nasdaq 100 Daily Chart
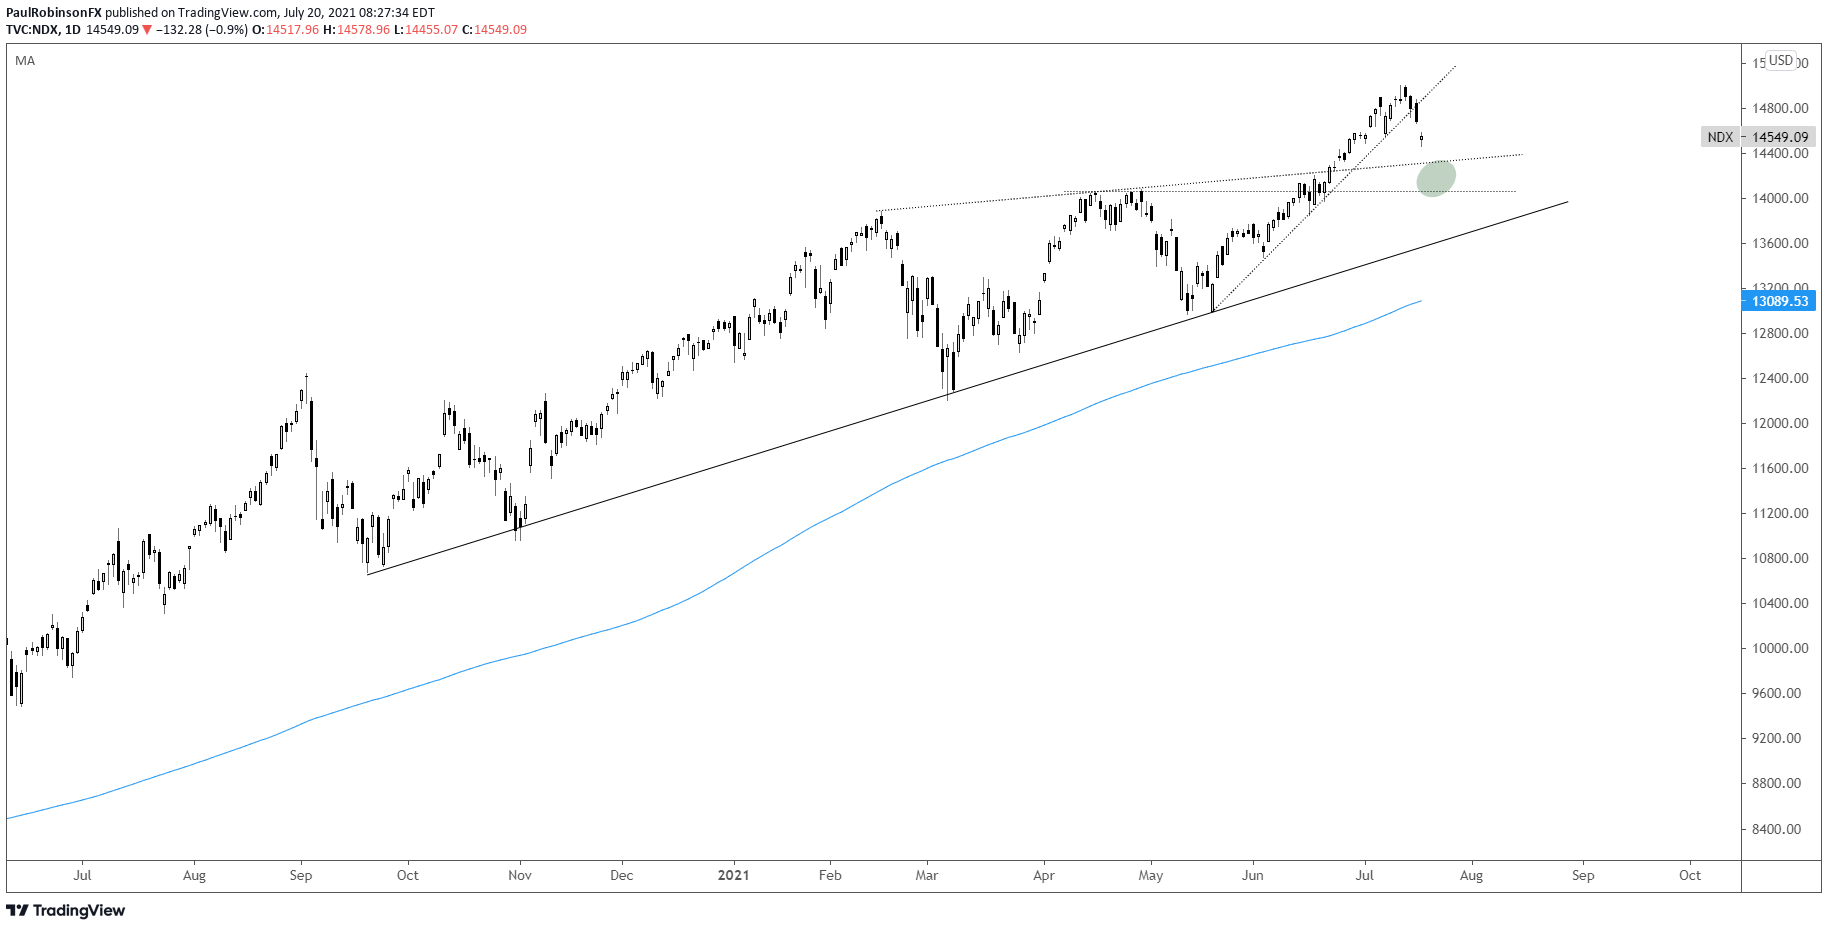
Nasdaq 100 Chart by TradingView
Dow Jones Daily Chart

Dow Jones Chart by TradingView
Resources for Forex Traders
Whether you are a new or experienced trader, we have several resources available to help you; indicator for tracking trader sentiment, quarterly trading forecasts, analytical and educational webinars held daily, trading guides to help you improve trading performance, and one specifically for those who are new to forex.
---Written by Paul Robinson, Market Analyst
You can follow Paul on Twitter at @PaulRobinsonFX


