


U.S. Indices Highlights:
- Nasdaq 100 gapped higher then reversed strongly
- Could mark beginning of more near-term weakness
- S&P 500 and Dow Jones lagging far behind
The Nasdaq 100 underwent a strong reversal yesterday to the tune of over -4%, not your garden variety sell-off from an intra-day high. But will it lead to a pullback lasting more than a session or two? Perhaps not, but the risk is we see a bit more short-term weakness before possibly firming up again. Divergences amongst major indices though could be signaling a turn lower is or very nearly ready to take hold.
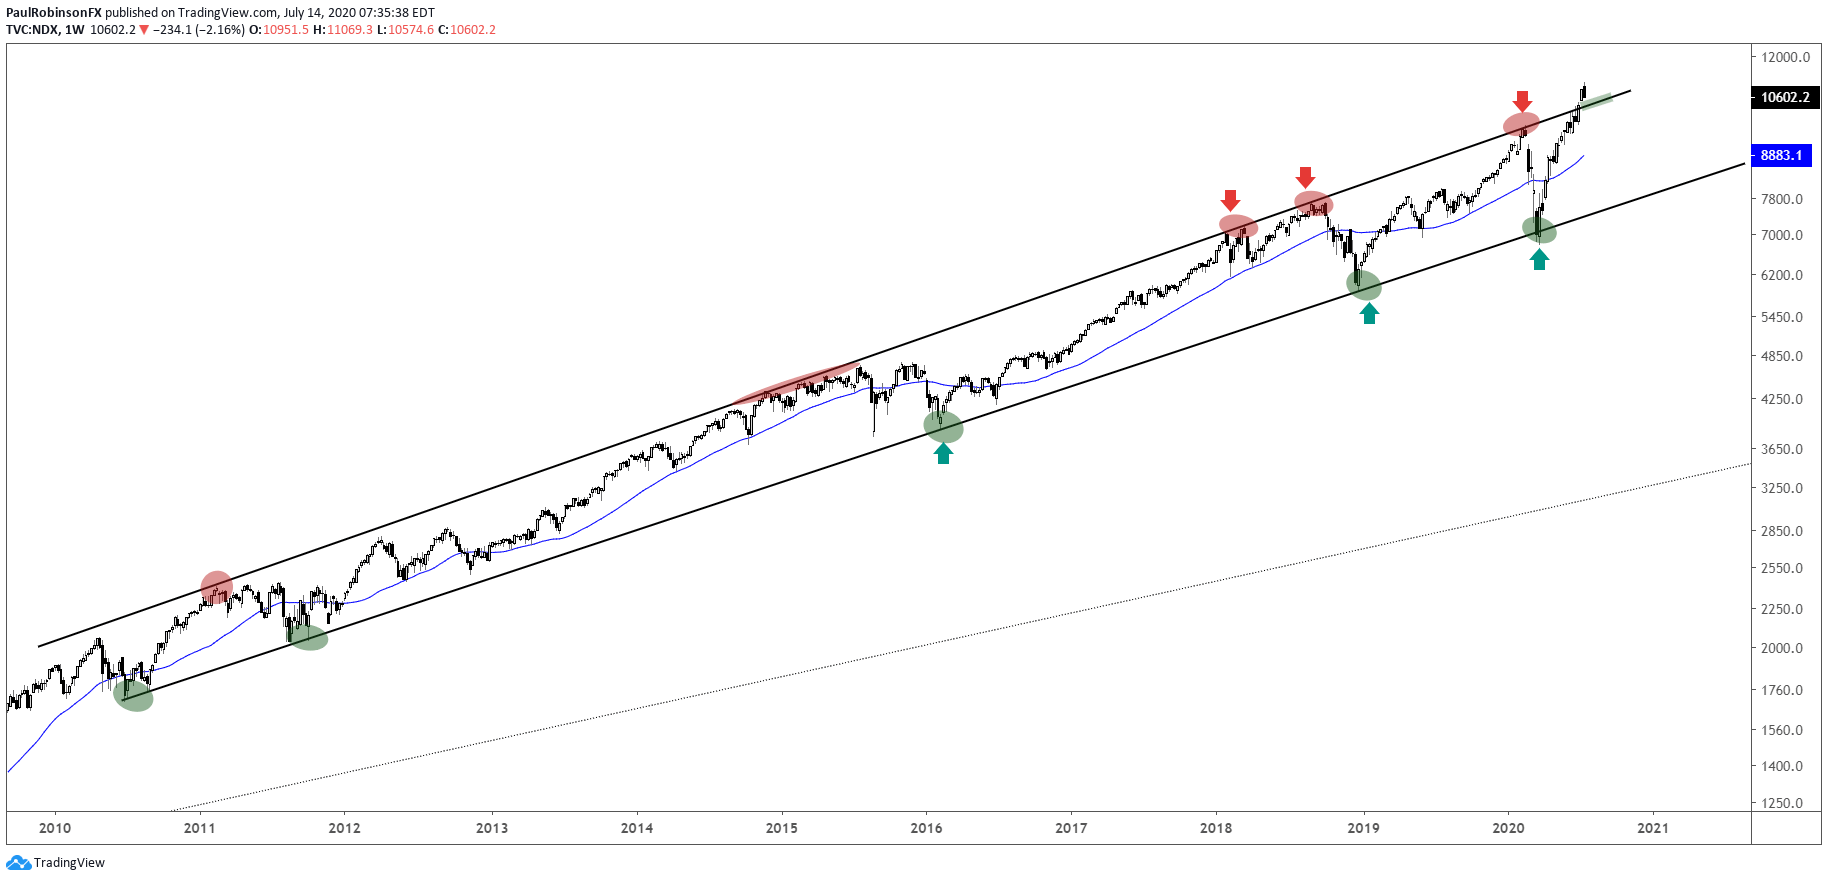
If the NDX declines back inside the short-term channel in place since April this will lead to a test of the top of the long-term channel in place since 2010. This could lead to some important turnabouts going forward. Because the NDX recently left the bullish structure built from a decade ago, it may mean that an acceleration higher (blow-off) is underway, and that we could soon see more upside after a smallish pullback. But perhaps the pop out of the top of the channel is an ‘overthrow’ that leads to a larger reversal. An overthrow is a smaller, less dramatic form of exhaustion that temporarily takes the market off its previous course (in this case higher outside the channel), but then leads to a significant turning point.
First thing is first, the lower side of the daily channel and top of the weekly channel could get tested here in the days ahead. A hold of this support would be constructive and keep the upside intact. However, a decline below the lower parallel on the daily, and more importantly a decline back inside the long-term bull channel would imply that we may have just witnessed an overthrow that is indeed signaling a larger top, and thus pointing to a meaningful decline. Hard to say at this point if this is the case.
But glaring divergence between the five-stock-heavy NDX (FANMAG – FB, AAPL, NFLX , MSFT, AMAZON, GOOG) and the broader S&P 500, Dow Jones, and other indices suggests things ‘under the hood’ of the market aren’t churning along so well. We shall soon see if that matters, or if money will rotate into other names.

Nasdaq 100 Daily Chart (big engulfing candle)

Nasdaq 100 Chart by TradingView
Nasdaq 100 Weekly Chart (outside bull
channel)
Nasdaq 100 Chart by TradingView
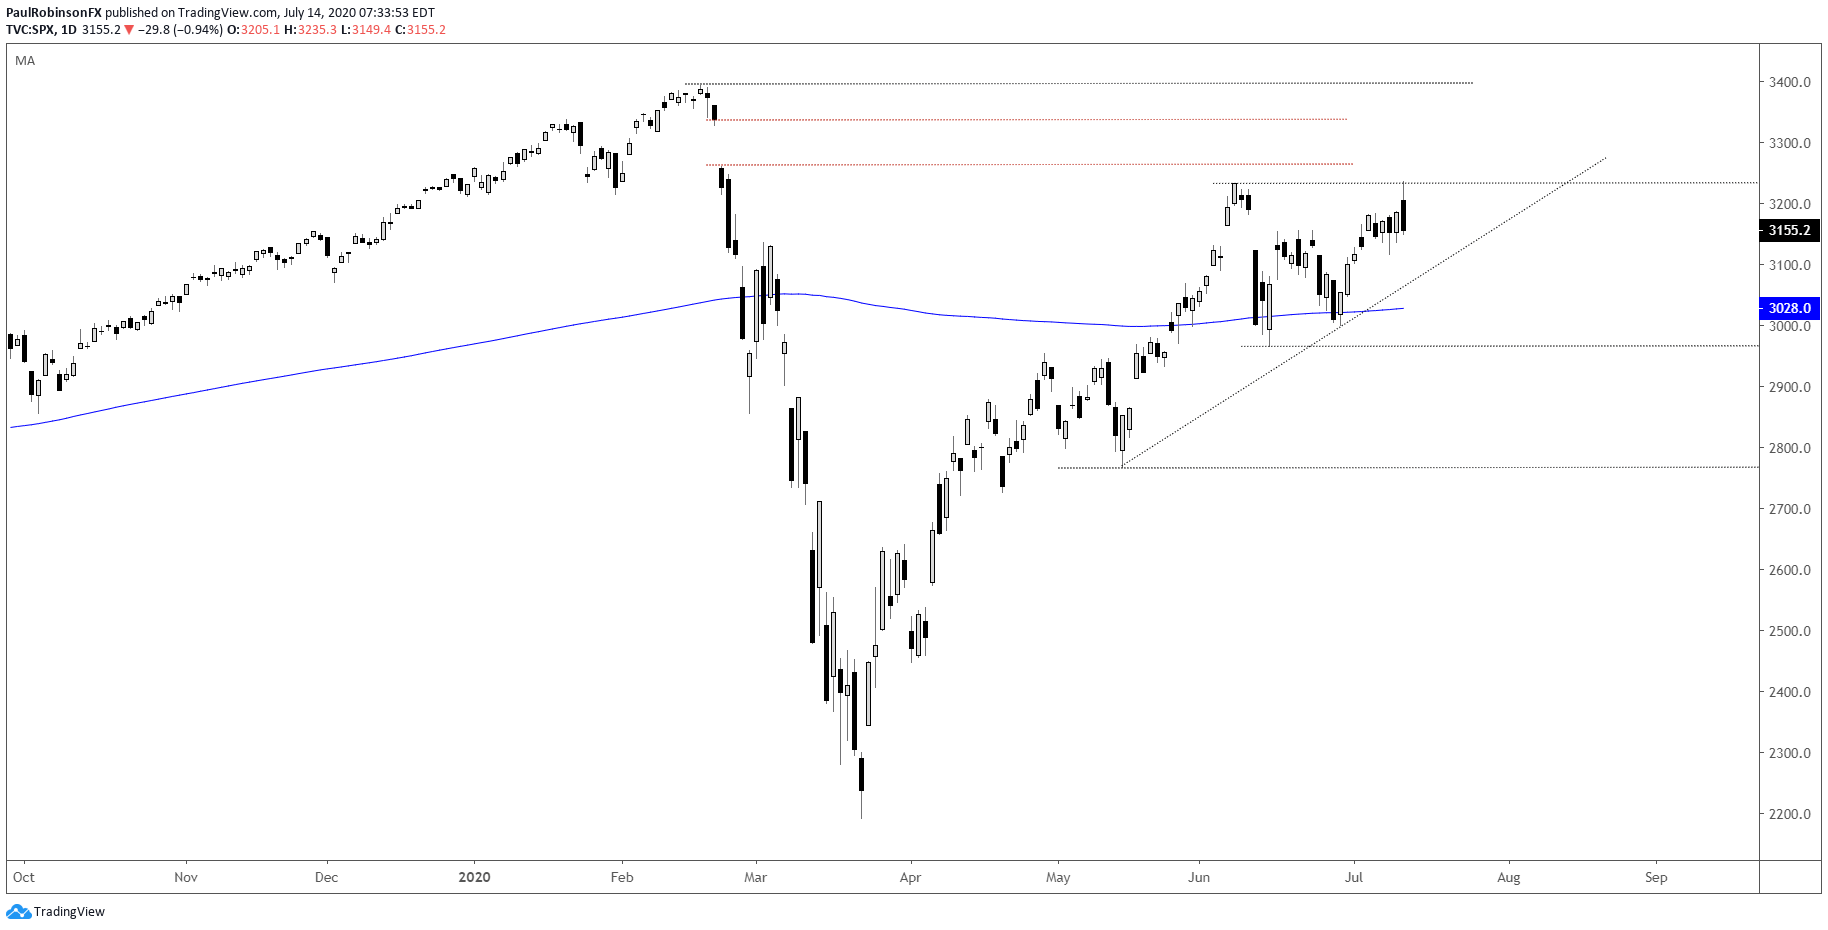
The S&P 500 has been relatively weak by comparison to the narrow Nasdaq 100. It tried to break to a new five-week high yesterday, but was unable to do so. The best case for now appears to be it holds onto the range down to around the 2965-mark.
The Dow Jones is struggling to get above the 200-day, and still remains a good distance from the June high. It wouldn’t take much to get back down to the range-lows near 24843, or worse to the lowest levels seen since May. So while the NDX is flying high the other indices, without as much help from the market darlings, are struggling to hold up. This could change and turn into a period of catch-up, but the short-term and longer-term divergences on display may be signaling trouble ahead as we progress into the second-half of the year.
S&P 500 Daily Chart (failed to break out)
Dow Jones Daily Chart (struggling around the 200-day)

Dow Jones Chart by TradingView
Resources for Forex Traders
Whether you are a new or experienced trader, we have several resources available to help you; indicator for tracking trader sentiment, quarterly trading forecasts, analytical and educational webinars held daily, trading guides to help you improve trading performance, and one specifically for those who are new to forex.
---Written by Paul Robinson, Market Analyst
You can follow Paul on Twitter at @PaulRobinsonFX


