


S&P 500 and Nasdaq 100 Highlights:
U.S. stocks at risk of declining further
The U.S. stock market was hit with force last week, taking the indices down by the most in a single day since the height of the coronavirus panic. The market though is trying to make that a one-off event with it working on stabilizing a bit.
The S&P 500 is doing so around the 200-day moving average, and regardless of whether the end of the pullback is here or another leg lower is coming, it comes as no surprise we are seeing some volatility around this widely-watched technical threshold.
If the market holds onto yesterday’s low at 2965, and can soon get moving higher, then it could quickly mark the end of a pullback and run towards the corona-gap that kicked off the Q1 sell-off. But if we lose yesterday’s low and the Nasdaq 100, a very important leading index, breaks the lower bounds of nearly two-month channel, then more selling appears to be in the cards.

S&P 500 Daily Chart (failed prior to ‘corona-gap’)

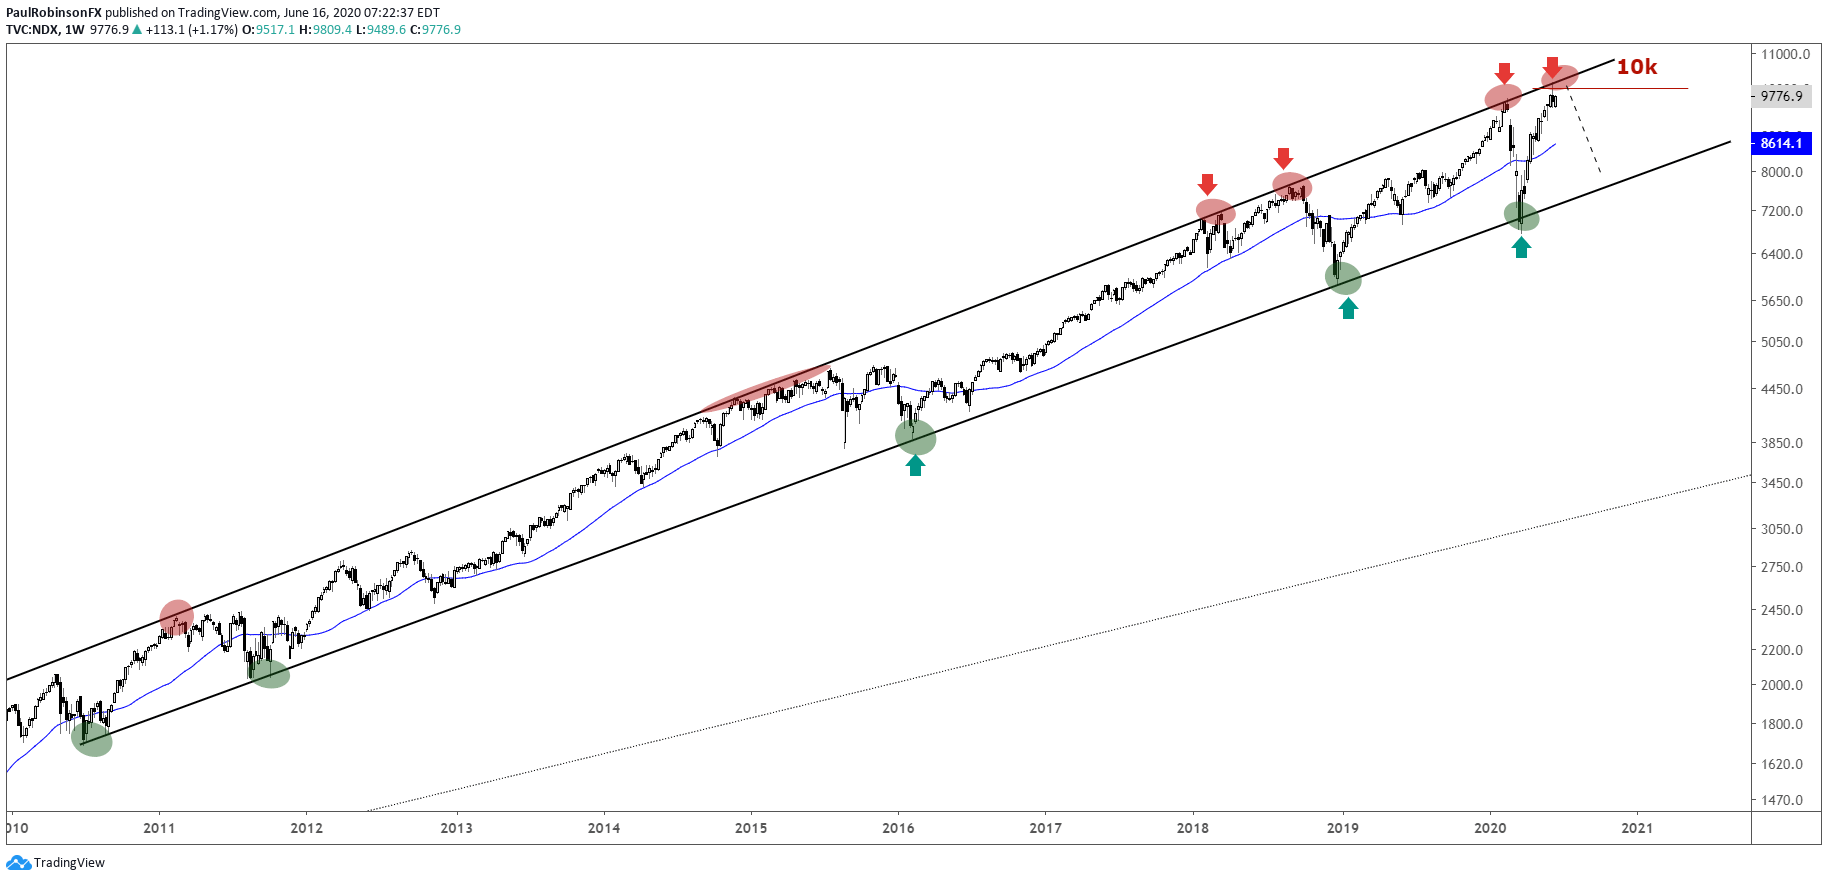
The Nasdaq 100 is the bull market leader, the keeper of the darling group of stocks known as FANMAG (Facebook, Apple, Netflix, Microsoft, Amazon, and Google). The fact that these are some of the most known and largest companies in the world means their performance has a big impact on the broader U.S. market and global markets as a whole.
Last week the NDX ticked the top of a long-term bull market channel while crossing 10k for the first time, it could mark a major turning point if the index can’t overcome it soon. We recently discussed the NDX dynamic in this article.
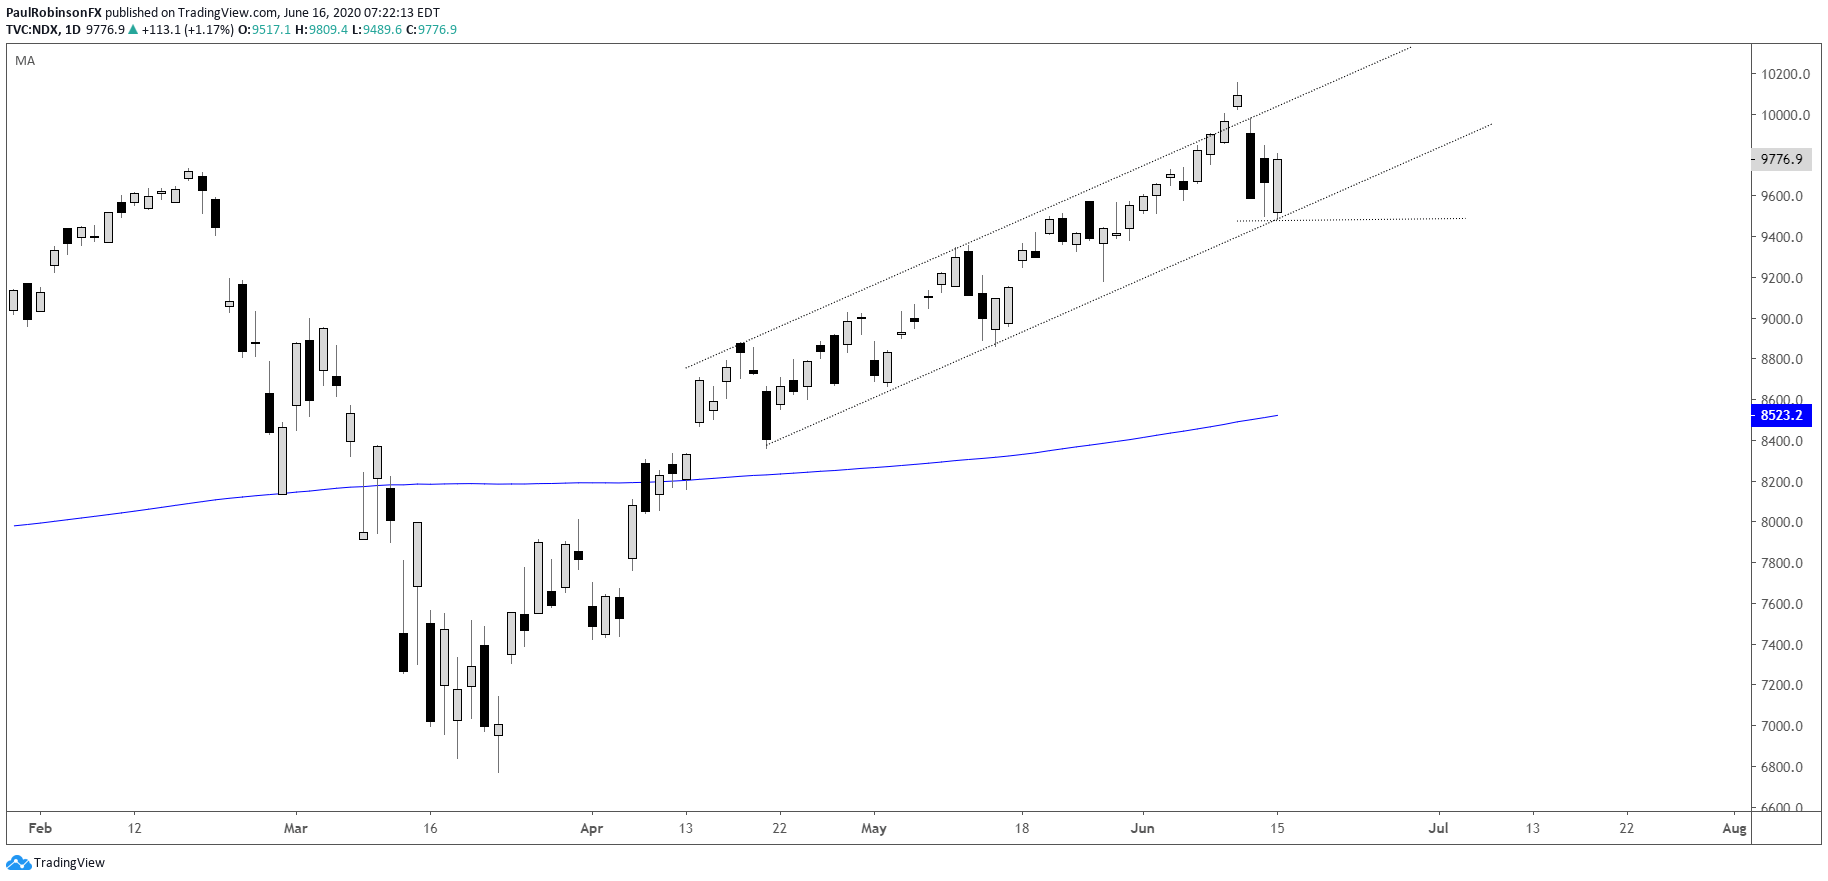
Looking at the shorter-term, there is a bullish channel in place since mid-April, that as of yesterday saw the lower parallel tested. A break of the lower parallel (close < 9489) should put the market on its heels. With the NDX having just faced major long-term resistance, the thinking is that there is a fairly high probability that we see the short-term channel broken. The cautious approach to take for would-be shorts would be to wait for the lower parallel to break, and if looking/holding long for another push higher the same threshold can be used to assess the downside.
Nasdaq 100 Weekly Chart (top of channel/10k)
Nasdaq 100 Chart by TradingView
Nasdaq 100 Daily Chart (near-term channel)
Nasdaq 100 Chart by TradingView
Resources for Forex Traders
Whether you are a new or experienced trader, we have several resources available to help you; indicator for tracking trader sentiment, quarterly trading forecasts, analytical and educational webinars held daily, trading guides to help you improve trading performance, and one specifically for those who are new to forex.
---Written by Paul Robinson, Market Analyst
You can follow Paul on Twitter at @PaulRobinsonFX


