


S&P 500 Index Technical Price Outlook: SPX500 Near-term Trade Levels
- S&P 500 Index updated technical trade levels & sentiment – Daily & 120min Charts
- SPX500 recovery at critical resistance barrier- bulls at risk while below 2930
- What is S&P 500? A Guide to the S&P 500 Index
The S&P 500 Index surged nearly 34% off the yearly lows with the rally extending into a critical resistance confluence today. We’re looking for a reaction up here with the broader rally at risk into this threshold. These are the updated targets and invalidation levels that matter on the SPX500 technical price charts. Review my latest Weekly Strategy Webinar for an in-depth breakdown of this SPX500 trade setup and more.
S&P 500 Price Chart – SPX500 Daily
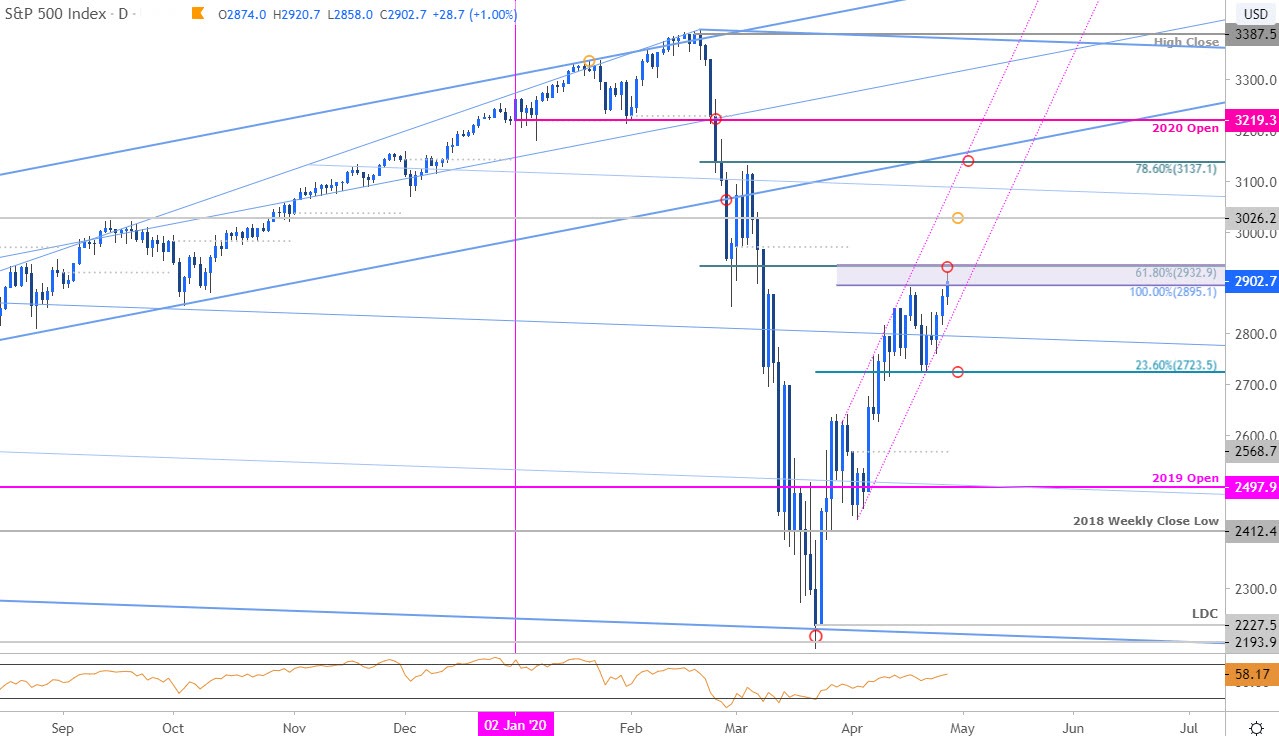
Chart Prepared by Michael Boutros, Technical Strategist; S&P 500 Index on Tradingview
Technical Outlook:In my last S&P 500 Price Outlook we noted that the index had, “rebounded off down-trend support with the recent price breakout now testing initial resistance…look for support ahead of 2300 IF price is heading higher with a breach above 2671 needed to suggest a more significant low is in place.” Price has rallied more than 13.5% in April with the breakout now targeting a critical resistance one at 2895-2932 – a region defined by the 61.8% retracement of the 2020 range and the 100% extension of the advance off the yearly low. The rally is vulnerable heading into this threshold with a breach / weekly close above needed to keep the March advance viable .
S&P 500 Price Chart – SPX500 120min
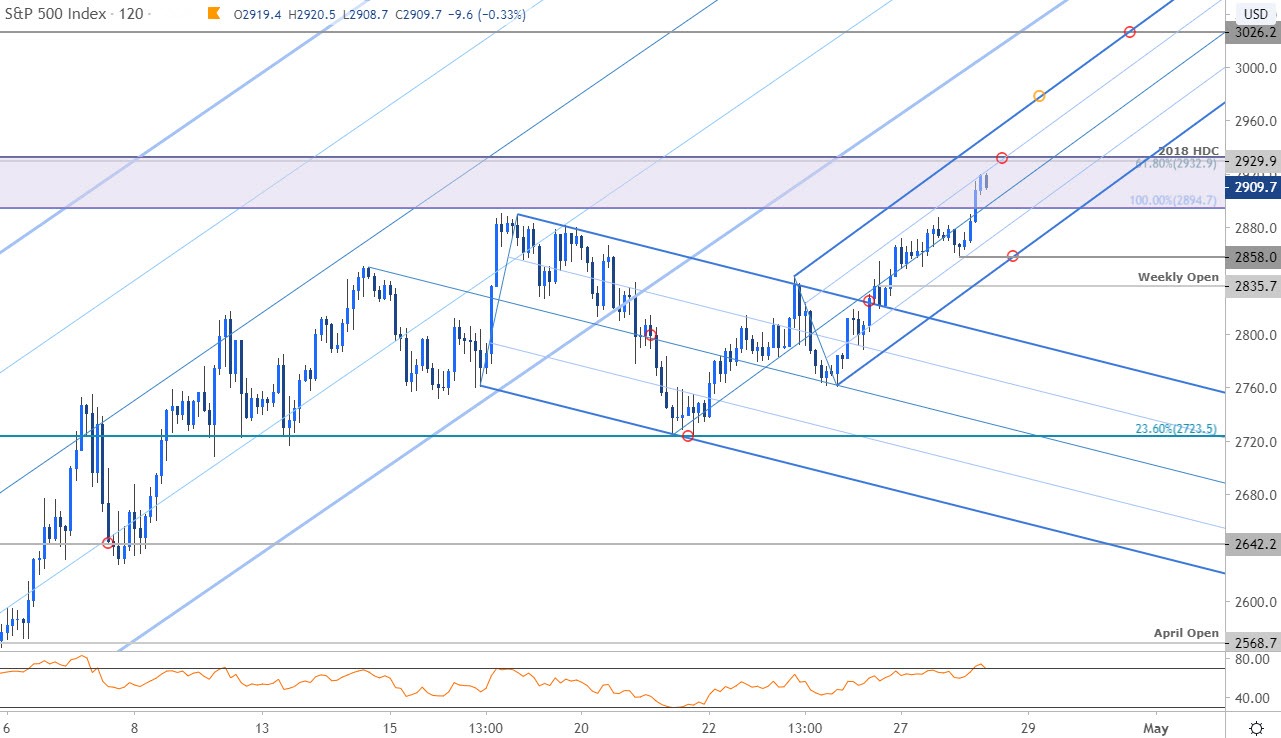
Notes: A closer look at S&P 500 price action shows the index breaching descending slope resistance last week with the advance trading within the confines of a near-term ascending pitchfork formation. The advance is vulnerable into this threshold with initial support eyed at yesterday’s low / slope support at 2858. A break below the weekly open at 2835 would be needed to validate a near-term reversal with such scenario threatening a larger correction towards 2723. A breach / close above 2932 keeps the focus on subsequent topside resistance objectives at the upper parallel (currently near ~2980s) and the July 2019 highs at 3026.

Bottom line: The S&P 500 rally has extended into a pivotal resistance barrier and the immediate focus is on a reaction up here with the bulls at risk sub-2930 near-term. From a trading standpoint, a good spot to reduce long positioning / raise protective stops- look for a possible exhaustion high into this zone. Ultimately a larger setback may offer more favorable entries closer to uptrend support with a breach higher needed to mark resumption of the broader uptrend.
For a complete breakdown of Michael’s trading strategy, review his Foundations of Technical Analysis series on Building a Trading Strategy
S&P 500 Trader Sentiment – SPX500 Price Chart
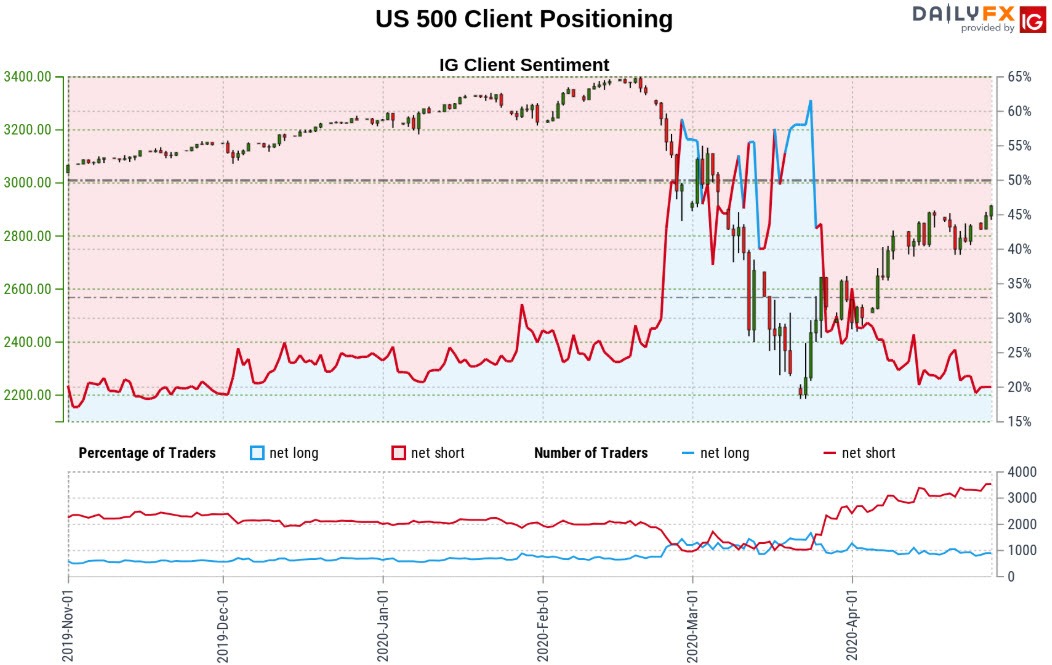
- A summary of IG Client Sentiment shows traders are net-short the index - the ratio stands at -3.09 (24.46% of traders are long) – bullishreading
- Long positions are0.58% lower than yesterday and 12.91% higher from last week
- Short positions are 0.25% lower than yesterday and 7.14% lower from last week
- We typically take a contrarian view to crowd sentiment, and the fact traders are net-short suggests US 500 prices may continue to rise. Yet traders are more net-short than yesterday but less net-short from last week. The combination of current positioning and recent changes gives us a further mixed S&P 500 trading bias from a sentiment standpoint.
| Change in | Longs | Shorts | OI |
| Daily | 1% | -1% | 0% |
| Weekly | 15% | -13% | -1% |
---
Active Trade Setups
- Dollar vs Mexican Peso Technical Price Outlook: USD/MXN Rally at Risk
- Canadian Dollar Price Outlook: Loonie on Offense as Oil Stabilizes
- Australian Dollar Price Outlook: Aussie Correction Underway- Levels
- Gold Price Outlook: XAU/USD Breakout Falters at Multi-year Highs
- Sterling Price Outlook: British Pound Breakout at Risk- GBP/USD Levels
- Written by Michael Boutros, Currency Strategist with DailyFX
Follow Michael on Twitter @MBForex


