


Dow Jones, S&P 500 Highlights:
- Dow Jones still has room to go before hitting support
- Long-term levels below for the S&P 500 too
- Watching for signs of a capitulation, then bounce
S&P 500 and Dow Jones looking to long-term support
As markets continue to get flattened, the question is when will the selling end, or at least subside? It is a complicated situation as black swan events unfold, as we are seeing, with new twists and turns each day as everyone scrambles with few precedence to turn to as guidance. Volatility is spiking into panic territory, with the VIX now registering levels not seen since the Great Financial Crisis.
From a pure technical and sentiment standpoint the market is getting close, but may still have a bit more to go before the kind of extreme is registered and support is met that is needed to put in a floor in on its own exhaustion in selling.
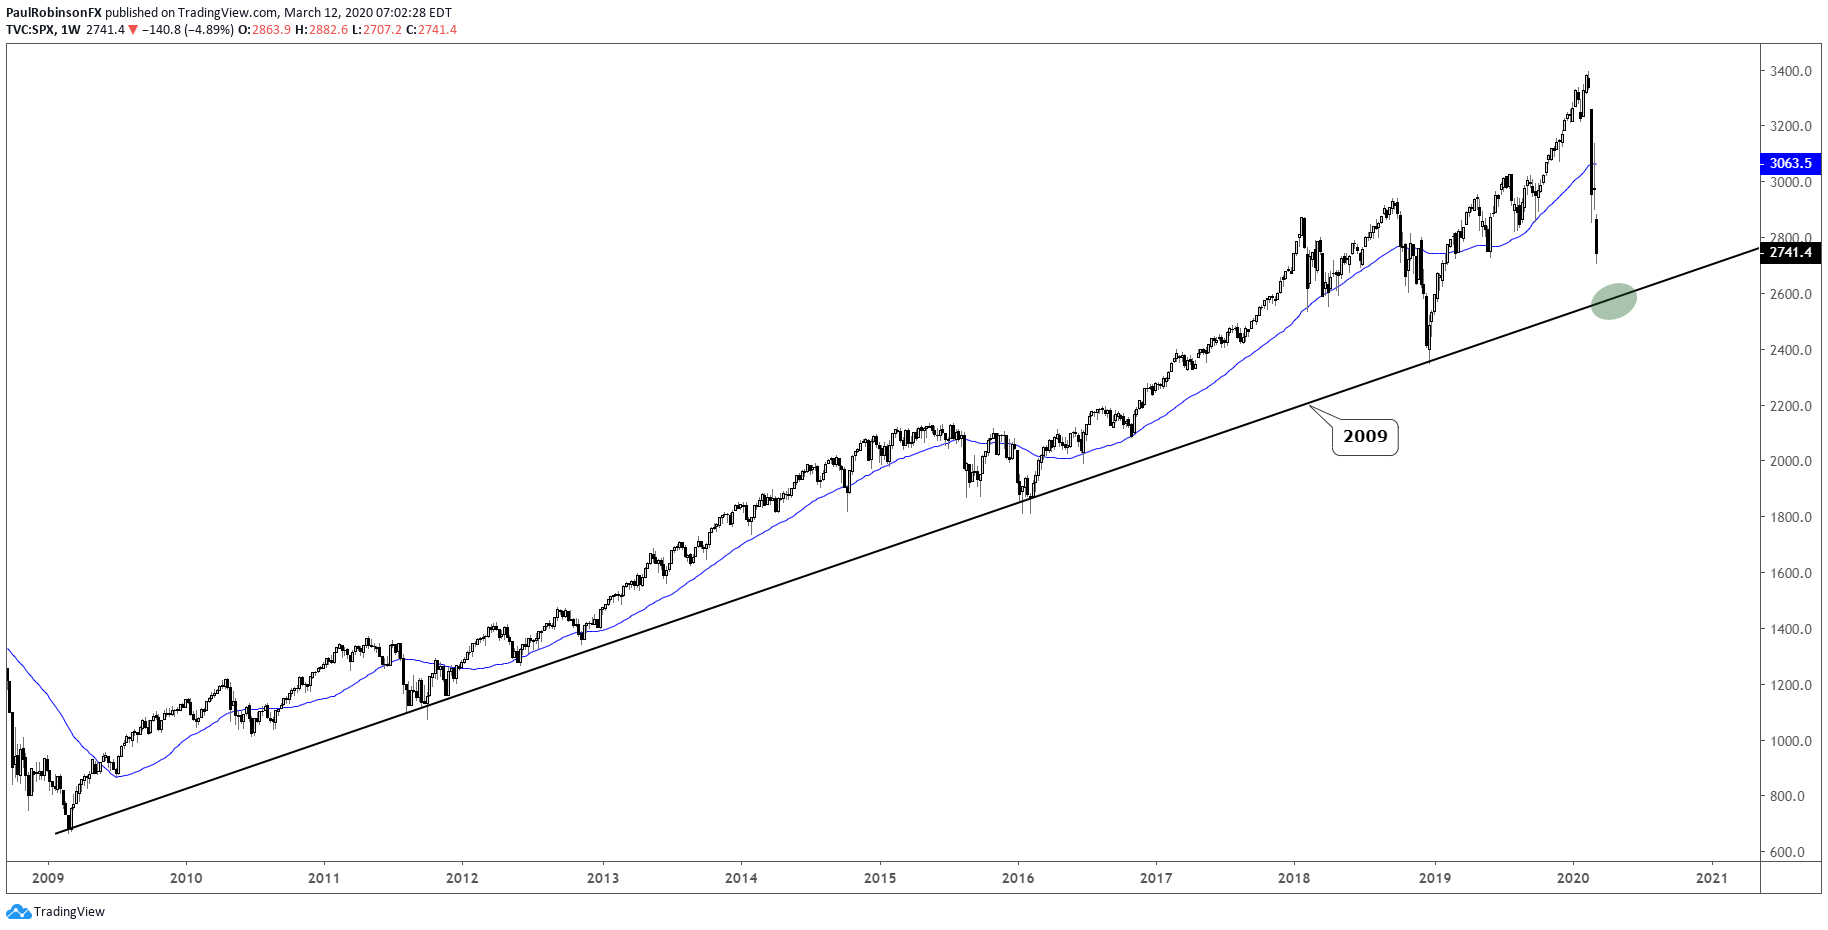
The bull market trend-line from the 2009 low is fast-approaching. It connects lows from 2011, 2016, and 2018. Will it be the low for 2020? That is far too early to determine, but it may be the low for the early part of 2020. It currently clocks in around 2565 on the cash index, give or take about 20 handles. The market may initially whiz on through for a moment before putting in a reversal, which would constitute a bullish rejection that may give even more merit to any turnaround that may develop from support.
VIX Chart (Spiking to 2008 Levels)


S&P 500 Weekly Chart (2009 trend-line nearing)
The Dow Jones, too, is of course fast-approaching the same line of support, which also roughly aligns with low from December of 2018. This makes the situation for the Dow especially precarious, though, from a long-term standpoint. A lower-low below the 2018 low after recently recording a record high could go a long way towards turning the trend lower in the longer-term. Either way we look headed for a big bounce, but it might be one that is used as an opportunity to offload into rather than be viewed by market participants as an opportunity to become more aggressive in adding to longs. That is too far ahead into the future to look to, especially with volatility this high, but may be worth a thought down the road.
For now, it looks like we might be near a capitulation in selling, and with support not that far away stocks could find a bid and a rebound. The situation is highly uncertain, so there will be plenty of two-way trade to be had with volatility this high. It is especially prudent in these conditions that traders be nimble and keep risk controls tight.
Dow Jones Weekly Chart (2009 trend-line, 2018 low)

Resources for Forex & CFD Traders
Whether you are a new or experienced trader, we have several resources available to help you; indicator for tracking trader sentiment, quarterly trading forecasts, analytical and educational webinars held daily, trading guides to help you improve trading performance, and one specifically for those who are new to forex.
---Written by Paul Robinson, Market Analyst
You can follow Paul on Twitter at @PaulRobinsonFX


