


US Indices Technical Outlook:
See where our analysts see the stock market heading in the Q4 Equity Market Forecast.
S&P 500 & Dow Jones still above H&S necklines
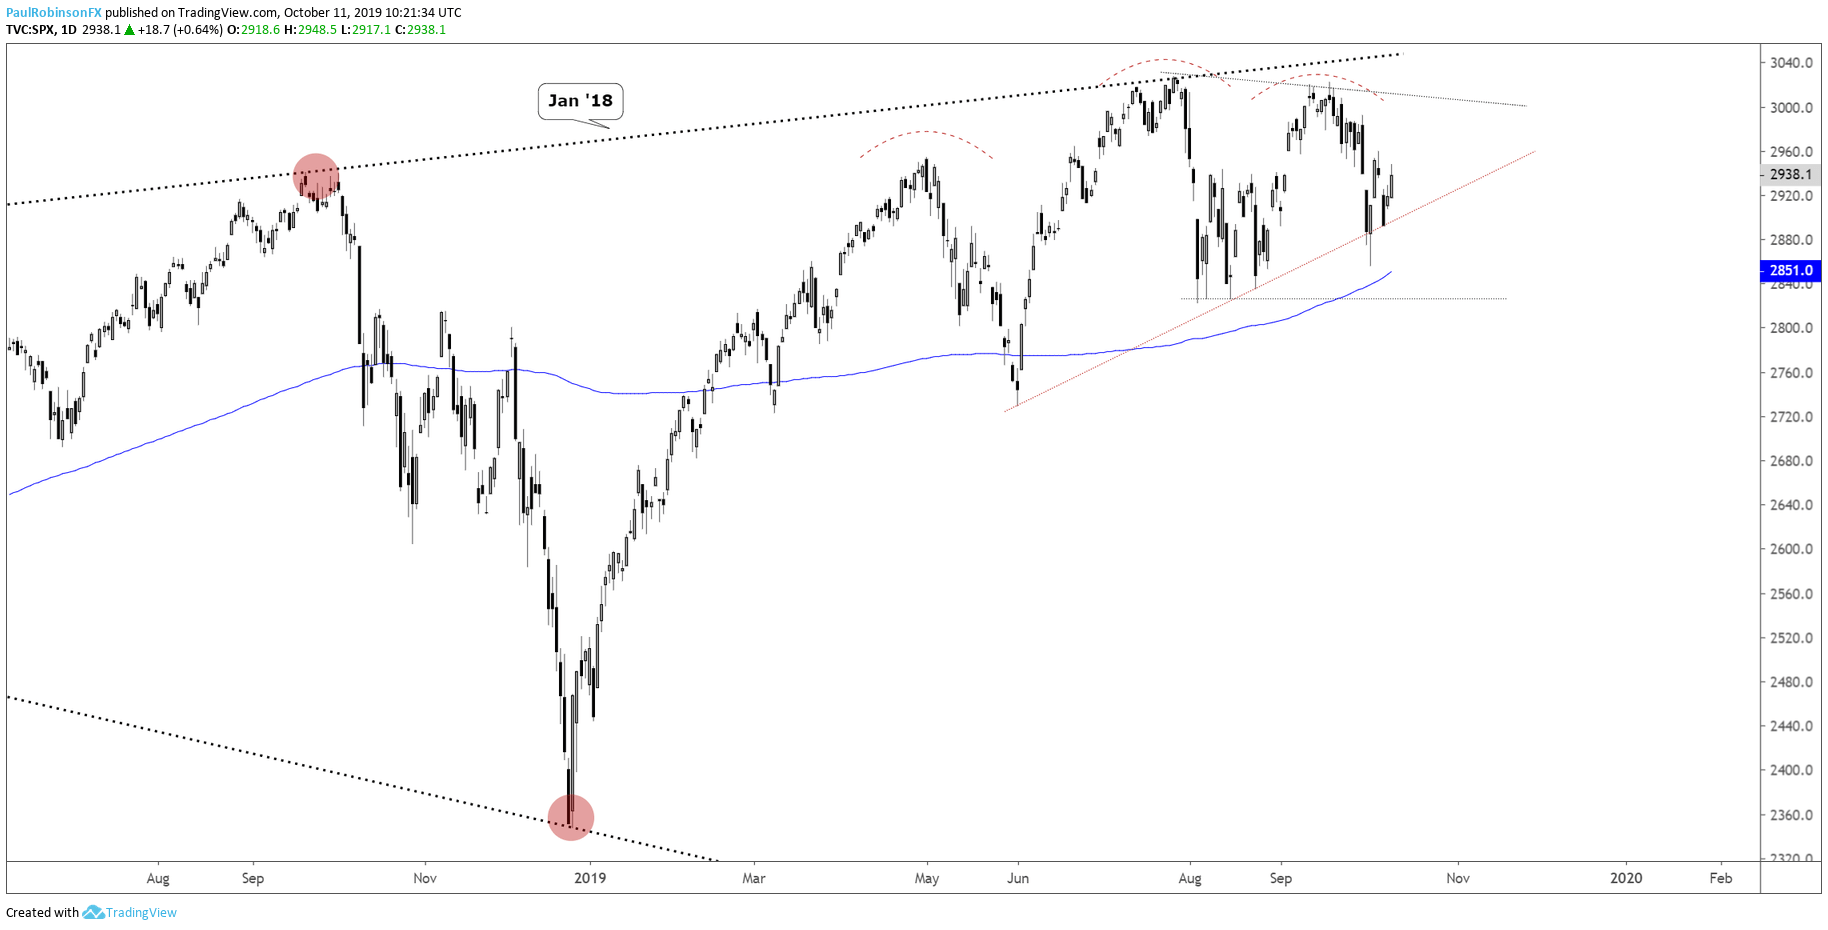
Last week the S&P 500 nearly broke the neckline of the head-and-shoulders (H&S) pattern that has been developing since May. This type of pattern must break the neckline to officially trigger, and until it does the outlook for the S&P will remain neutral to bullish.
A breakdown below the neckline would quickly bring into the play the 200-day at 2851, which may bring some fireworks, but with the pattern broken it may not hold long as support. If this doesn’t play out soon, though, the likelihood increases that another pattern (wedge/triangle) forms.
There are converging trend-lines from the bottom and top-side that are set to collide in the weeks ahead in the event the market doesn’t roll over. The wedge could still have the same bearish outcome that the H&S pattern implies, but we will need to wait some time before that unfolds.
A bullish break of a wedge pattern could be the alternate outcome as well. All-in-all, indecisive price action puts this market participant on hold until further notice. As outlined in the section below discussing the Nasdaq 100, there are reasons to think that the market will decline this quarter, but until there is price confirmation from one of the world’s most important indices, that bias will need to be put on hold for the time-being.
S&P 500 Daily Chart (H&S pattern yet unconfirmed)
The outlook for the Dow Jones is nearly identical to the S&P 500. The one interesting point about the Dow is that the neckline (or potential bottom-side of wedge) is in confluence with the 200-day MA, so a breakdown could become swift if support below 25734 breaks.
Dow Jones Daily Chart (H&S or wedge?)
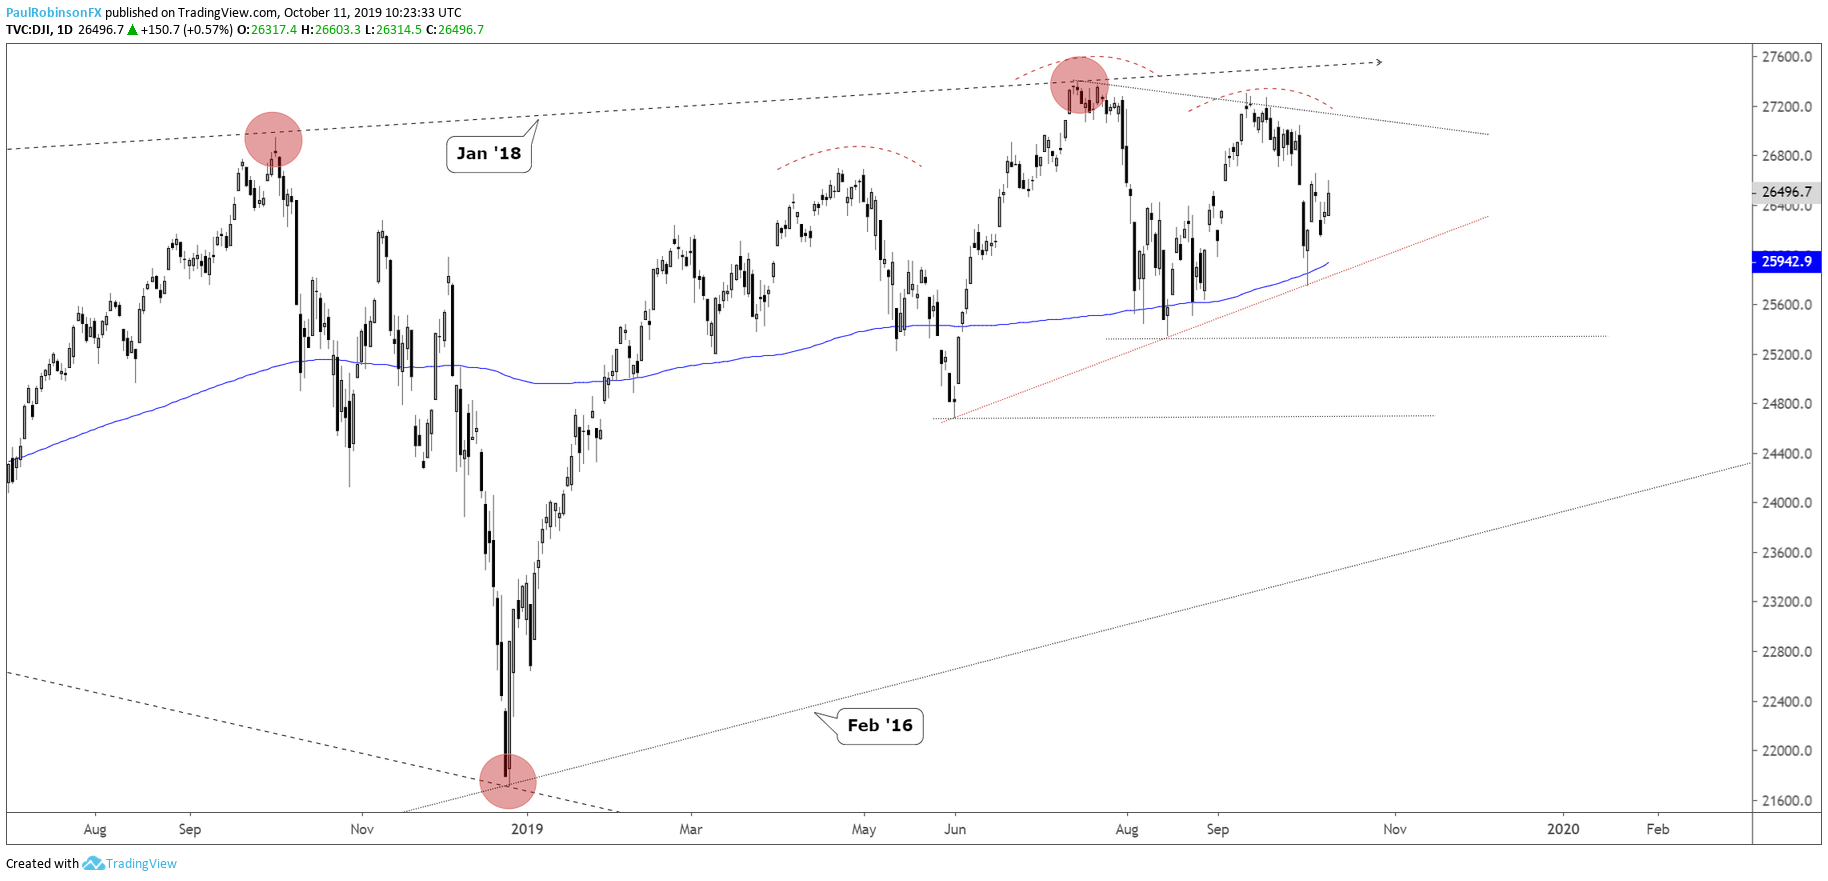
Dow Jones Chart by TradingView
Check out the IG Client Sentiment page to see how retail traders are positioned and what it could potentially mean for various currencies and markets moving forward.
Nasdaq 100 outside of H&S, big-picture wedge
In my book the Nasdaq 100 is considered to be the most important index in the world, with it dominated by some of the largest, most important companies in the world. For more on this, check out last week’s piece – Dow Jones, Nasdaq 100 Technical Forecast Darkens on Breakdown.
What is big here with the NDX, aside from its importance, is that it has already triggered the neckline of a H&S formation and even more bearishly, the rising wedge dating back to last year. There is potential for a wedge to develop, but right now the break in place may be a sign of a market on the verge of rolling over with strong momentum.
In the days ahead keep an eye on how a retest of the underside of the December trend-line (bottom of rising wedge/neckline) plays out. Should price hold up, then the wedge scenario will begin to grow traction and we’ll have to adjust the outlook accordingly.
Nasdaq 100 Daily Chart (broke H&S, rising wedge)
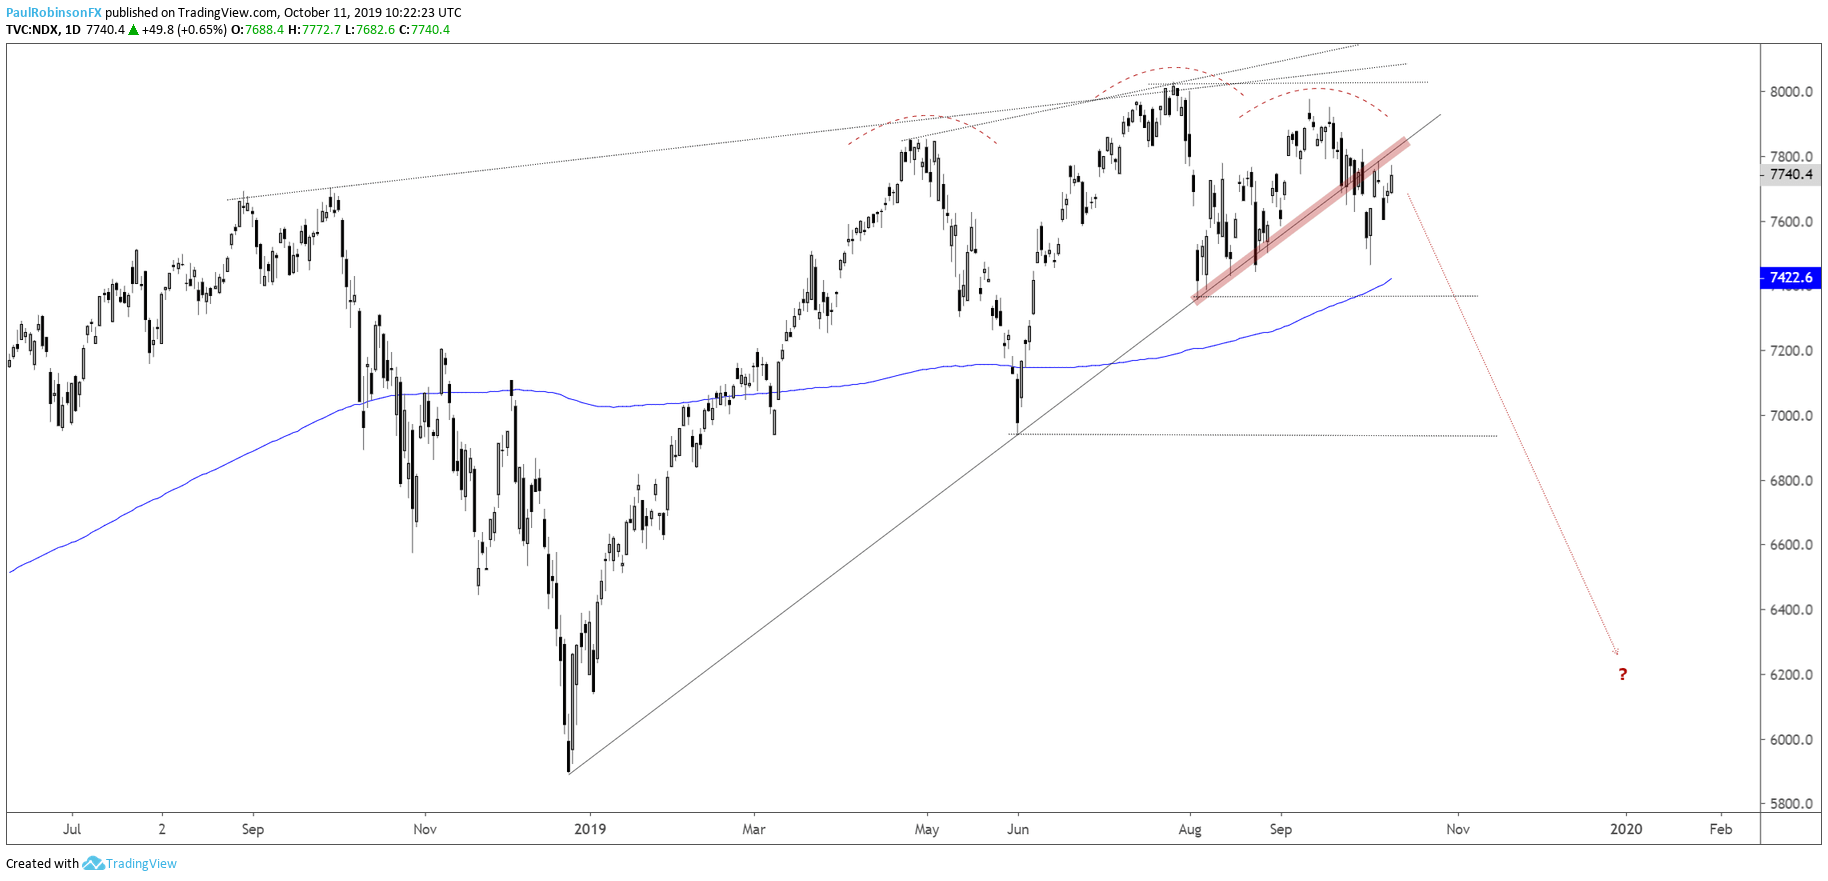
Nasdaq 100 Chart by TradingView
To learn more about U.S. indices, check out “The Difference between Dow, Nasdaq, and S&P 500: Major Facts & Opportunities.” You can join me every Wednesday at 10 GMT for live analysis on equity indices and commodities, and for the remaining roster of live events, check out the webinar calendar.
Tools for Forex & CFD Traders
Whether you are a beginning or experienced trader, DailyFX has several resources available to help you; indicator for tracking trader sentiment, quarterly trading forecasts, analytical and educational webinars held daily, trading guides to help you improve trading performance, and one specifically for those who are new to forex.
---Written by Paul Robinson, Market Analyst
You can follow Paul on Twitter at @PaulRobinsonFX


