


Dow Jones, Nasdaq 100 Technical Outlook:
- Nasdaq 100 cracks important support, triggers patterns
- Dow Jones in critical test, but set up to fail
See where our analysts see the stock market heading in the Q4 Equity Market Forecast.
Nasdaq 100 cracks important support, triggers patterns
Lately I’ve been discussing the Nasdaq 100 and its importance to not only the outlook for U.S. markets, but for global markets as a whole. When connecting the dots, it makes sense why the NDX may indeed be the most important index on the planet.
The Nasdaq 100 is home to some of the world’s largest, most well-known companies – Facebook, Apple, Amazon, Netflix, Google (also known as FAANG), as well as Microsoft. Combined, these bull market darlings make up half of the NDX, and as a group they have been leaders up until last year when they began to lose momentum when compared to the broader market.
This isn’t a good sign for healthy risk-taking behavior. There are other signficantly negative factors in play here as well. Check out the major divergence between small-caps (Russell 2k) and large cap stocks (S&P 500), -15% vs -4% from record levels, respectively, and the recent stall in the IPO market evidenced by the cancellation of the highly anticipated WeWork IPO. For more on the weakening IPO market, check out this piece by Peter Hanks – S&P 500 Outlook: IPO Market Hints at Gradual Shift in Risk Appetite.
Getting back to connecting the dots: If the market leaders are weak and investors are shying away from risk, then that will show up in the Nasdaq 100, which will also show up in the S&P 500, and with the U.S. markets accounting for ~55% of global stock market capitalization it is going to impact everyone else.
Looking at the Nasdaq 100 technical landscape on its own, it is making an important break this week with the triggering of both an intermediate-term head-and-shoulders (H&S) pattern and longer-term rising wedge dating back to last year.
These patterns can lead to serious declines, especially when under the hood the market has been losing power for some time now. A decline towards last year’s lows this quarter isn’t out of the question.
Looking at the near-term, the first level of support arrives at the confluence of the August low and 200-day MA. A break below there will provide the market with a lot of separation from the aforementioned pattern breaks below the December trend-line. Beneath there the June low at 6936 comes into focus.
Much work is needed from here to turn the technical landscape bullish. Resistance will first clock in if a retest of the December trend-line takes shape, but the market may continue lower without such a test developing.
Check out the IG Client Sentiment page to see how retail traders are positioned and what it could potentially mean for various currencies and markets moving forward.
Nasdaq 100 Daily Chart (Broke the H&S neckline, wedge formation)
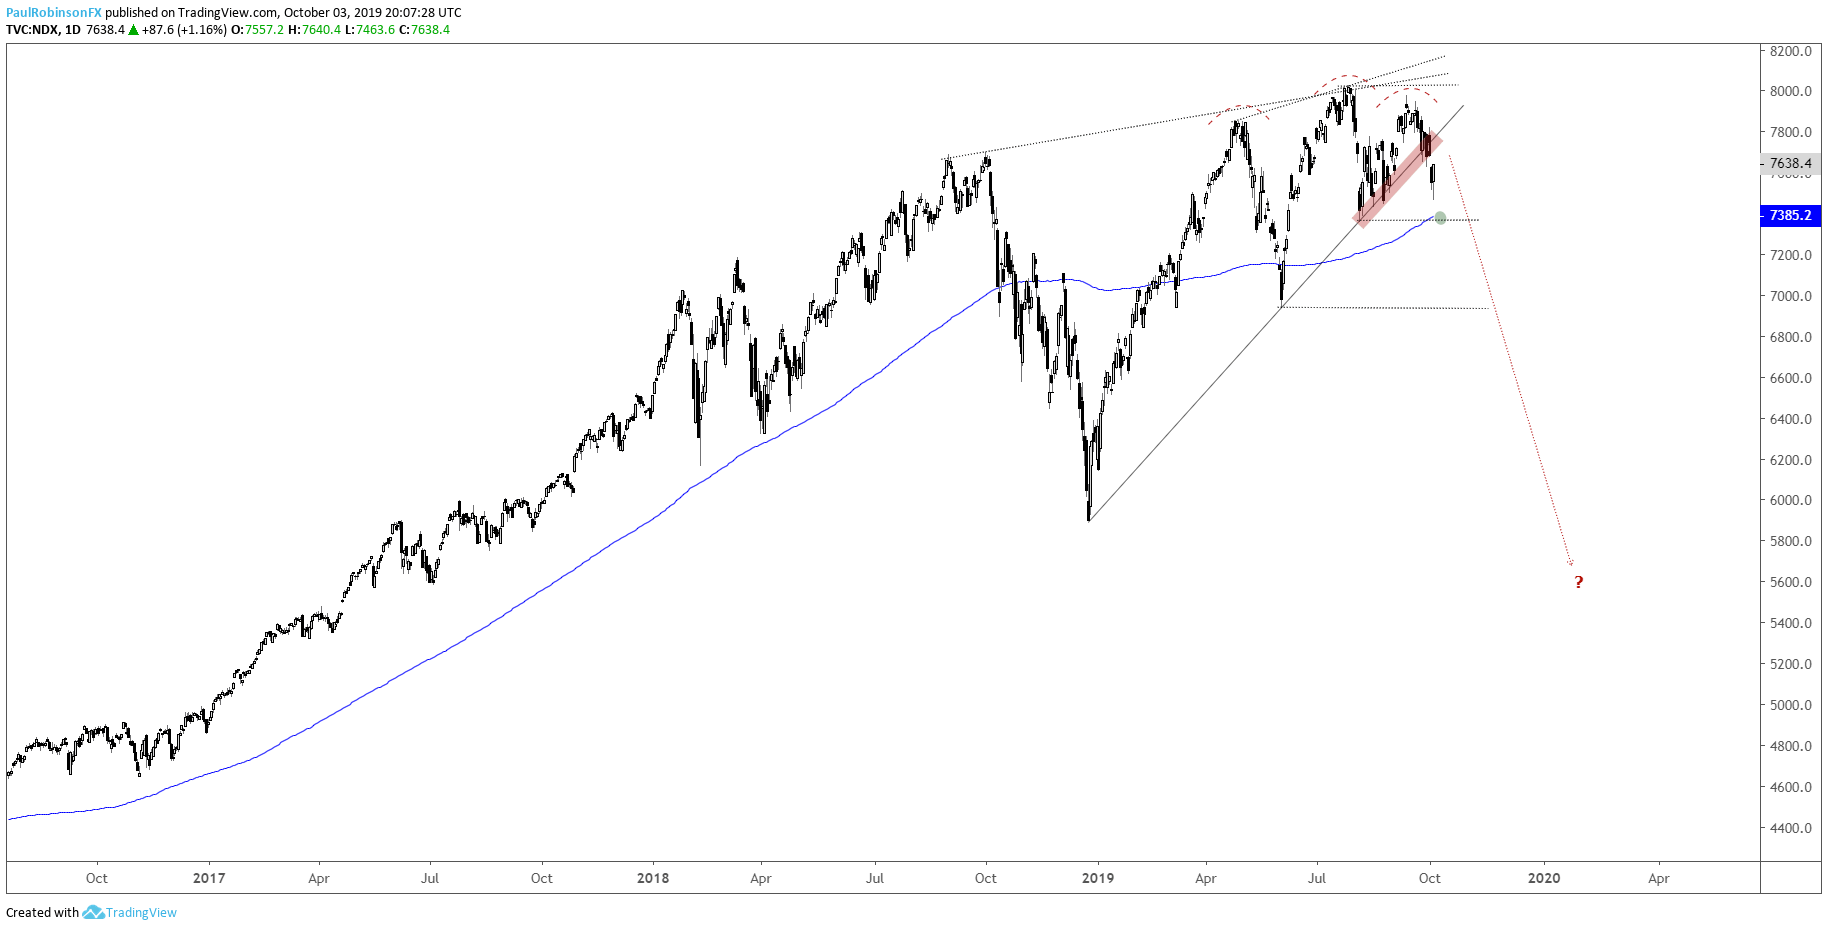
Nasdaq 100 Chart by TradingView
Dow Jones in critical test, but set up to fail
The Dow at this point looks like it is along for the ride, but it has its own head-and-shoulders (H&S) that has yet to crack, with the index tagging the neckline yesterday, that is also in confluence with the 200-day MA.
A bounce may keep things propped up for a short while, but it seems this pattern will go the way of the NDX. Confluent support should still be respected until broken, though. A breakdown, however, will quickly have the August low at 25339 in sight and could be followed by the June low at 24680.
Dow Jones Daily Chart (H&S neckline, 200-day MA)
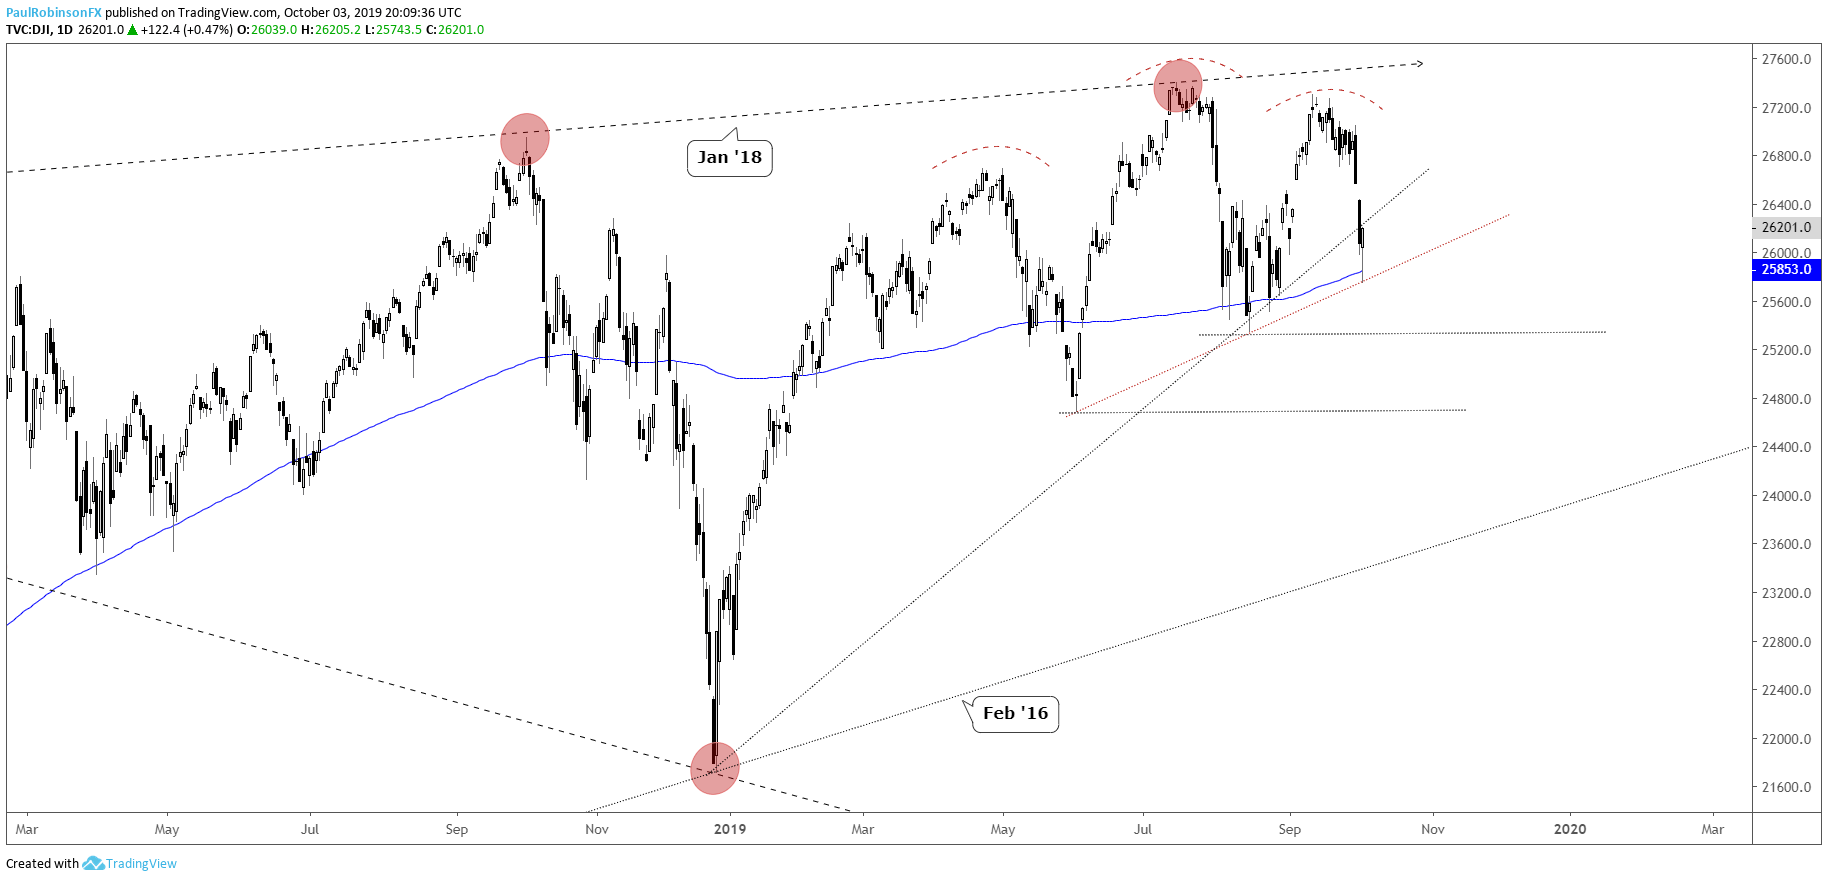
Dow Jones Chart by TradingView
To learn more about U.S. indices, check out “The Difference between Dow, Nasdaq, and S&P 500: Major Facts & Opportunities.” You can join me every Wednesday at 10 GMT for live analysis on equity indices and commodities, and for the remaining roster of live events, check out the webinar calendar.
Tools for Forex & CFD Traders
Whether you are a beginning or experienced trader, DailyFX has several resources available to help you; indicator for tracking trader sentiment, quarterly trading forecasts, analytical and educational webinars held daily, trading guides to help you improve trading performance, and one specifically for those who are new to forex.
---Written by Paul Robinson, Market Analyst
You can follow Paul on Twitter at @PaulRobinsonFX


