


S&P 500/Nasdaq 100/Dow Jones Technical Highlights:
- S&P 500 may bounce soon but looking for early-year lows still
- Dow Jones Feb ’16 & Feb ‘18 trend-lines at hand
- Nasdaq 100 continues to lead weakness, nearing earlier-year lows
With global stocks falling sharply, see how this fits into our outlook for the remainder of the year in the Q4 Global HEquities Forecast.
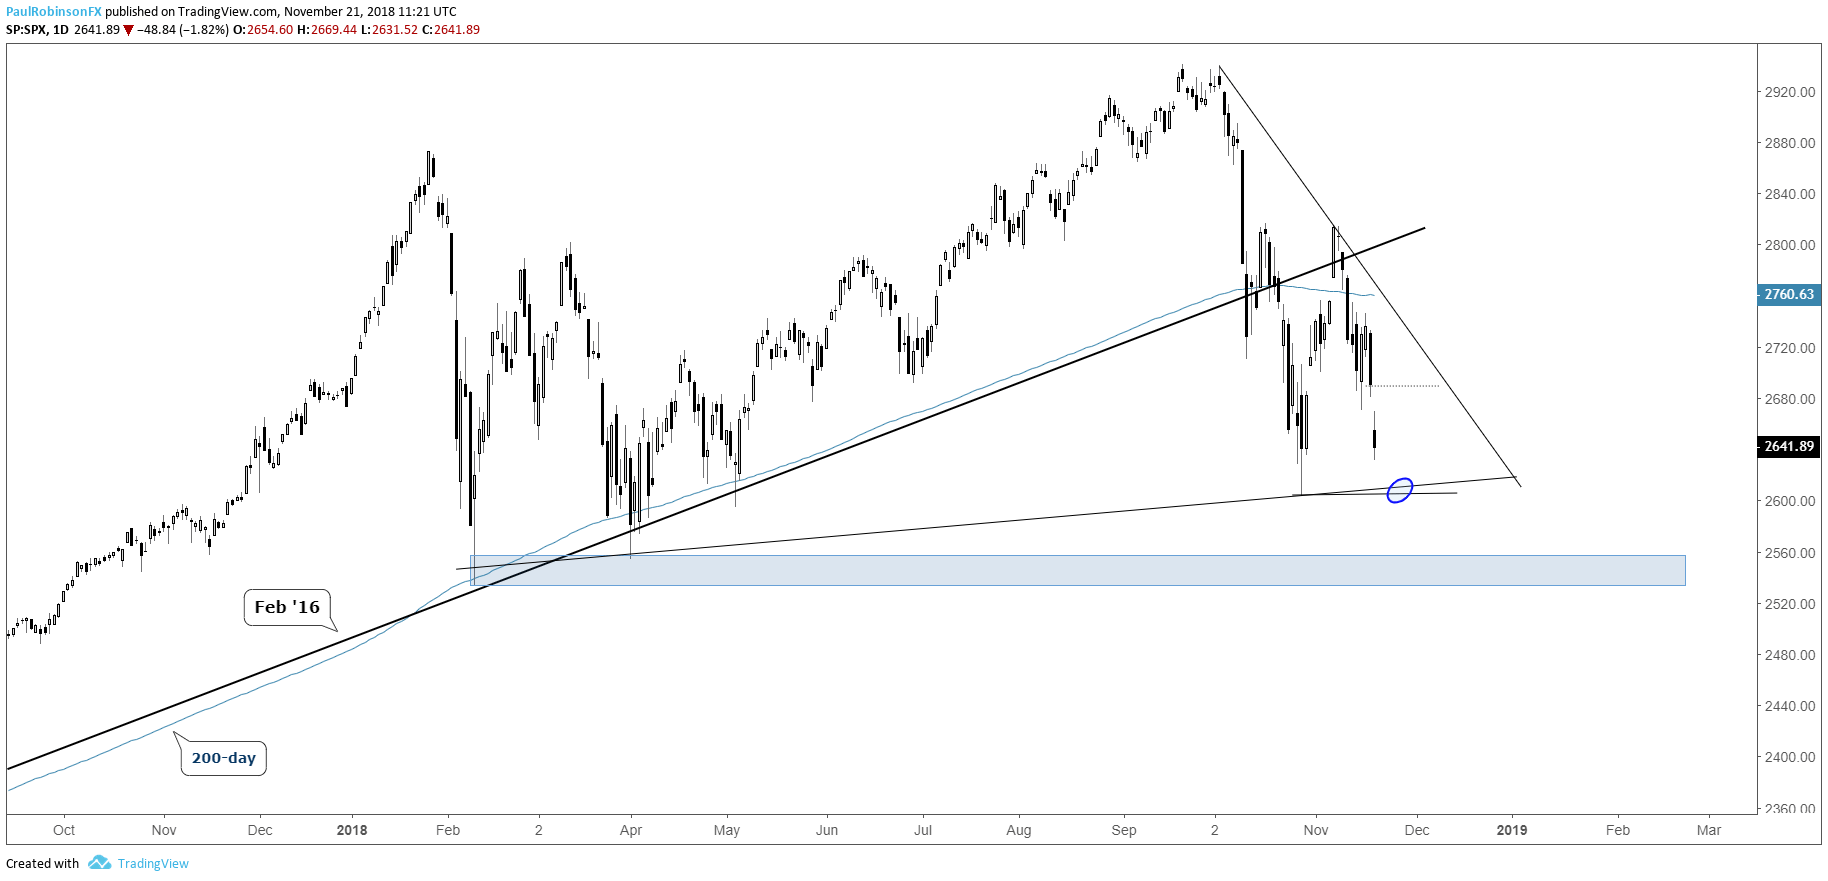
S&P 500 may bounce soon but looking for early-year lows still
When I last discussed U.S. indices they were sitting considerably higher, and it was noted that traders should beware of a steep decline even if the worst of the down-move was over. At this time we are presented with at best a double-bottom retest in the S&P 500. However, with the bull market leader, the Nasdaq 100 and its leading group of stocks (‘FAANG’), already having made an important new low, more weakness is expected.
However, a sharp bounce could develop, first, as volatility is expected to remain high for the foreseeable future and support levels are nearby. In conjunction with the October low at 2603 there is a trend-line extending over from February (it’s not the most precise with the connecting candle wicks, but nevertheless it runs in the general vicinity of last month’s low).
First up as resistance on any strength will be the gap from yesterday running up to 2690. Followed by a fill there isn’t any great price resistance for a good ways up and if the market is to trade lower, while a sharp bounce could unfold, it may not make it back to meaningful levels up over 2740 to 2760 or the trend-line off the record high.
A sustained break below the October low will have the Feb/April lows in focus from 2553 down to 2532. This area will be huge for the market and likely to at least spur some short-term buying interest, if not end the decline for a larger recovery.
Traders are reacting to the uptick to volatility, to see how check out the IG Client Sentiment page.
S&P 500 Daily Chart (October low, t-line near)
Dow Jones Feb ’16 & Feb ‘18 trend-lines at hand
With the Dow having been the strongest of the major indices during these turbulent times it is still holding onto the important Feb ’16 trend-line the S&P 500 broke last month. Also in the vicinity is another t-line from February of his year. The October low at 24122 is in the neighborhood as well. This makes for a strong cross-road. If held, the gap-fill to 25017 is first up as resistance, not far away from the 200-day at 25095. A breakdown will have the earlier-year lows on deck from 23531 down to 23360. There were three bottoms in that zone, making it a huge area of support.
Dow Daily Chart (Oct, Feb ’16 & 18 t-line support)

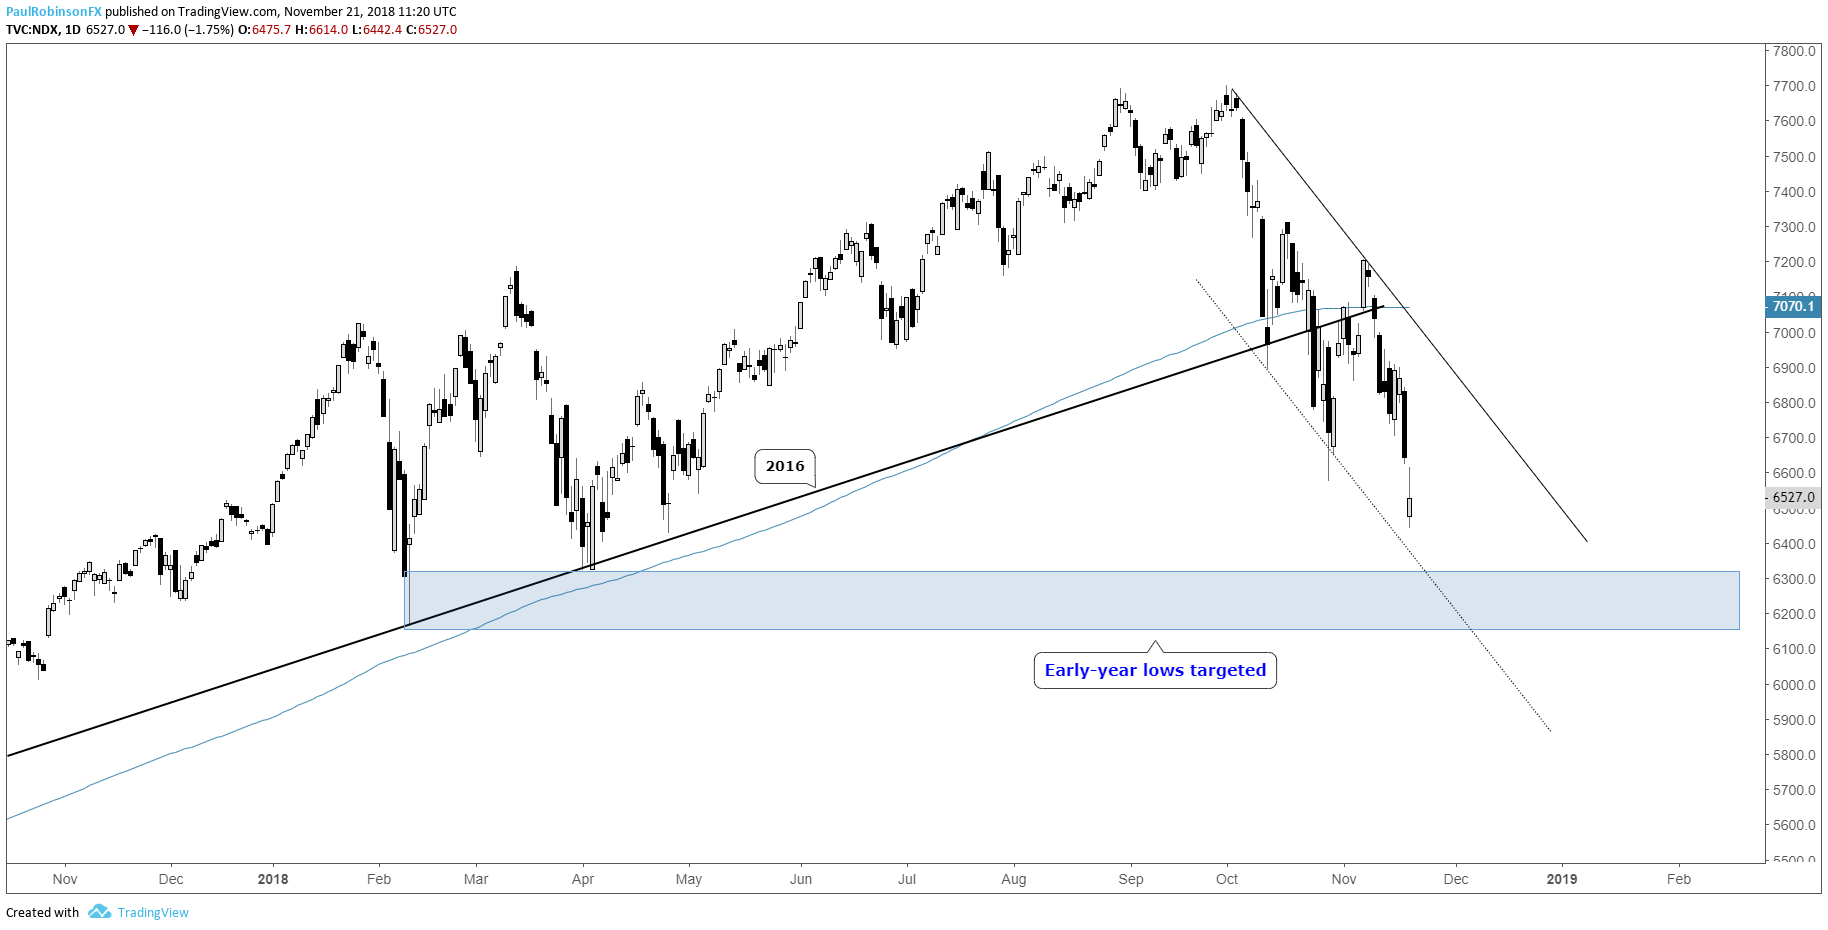
Nasdaq 100 continues to lead weakness, nearing early-year lows
The Nasdaq 100 posted a lower-low yesterday and suggests the other two major U.S. indices could soon do the same. The early-year lows are already in sight to be tested from 6322 down to 6164. A bounce from here won’t have any substantial resistance until the trend-line off the record high. Yesterday the gap at 6642 was nearly filled, but not quite.
Nasdaq 100 Daily Chart (Early-year lows targted)
To learn more about U.S. indices, check out “The Difference between Dow, Nasdaq, and S&P 500: Major Facts & Opportunities.” You can join me every Wednesday at 10 GMT for live analysis on equity indices and commodities, and for the remaining roster of live events, check out the webinar calendar.
Tools for Forex & CFD Traders
Whether you are a beginning or experienced trader, DailyFX has several resources available to help you; indicator for tracking trader sentiment, quarterly trading forecasts, analytical and educational webinars held daily, trading guides to help you improve trading performance, and one specifically for those who are new to forex.
---Written by Paul Robinson, Market Analyst
You can follow Paul on Twitter at @PaulRobinsonFX


