Highlights:
- S&P 500 puts in bearish gap-and-trap to start the week’s trading
- But then quickly took it back, volatility on the up-tick
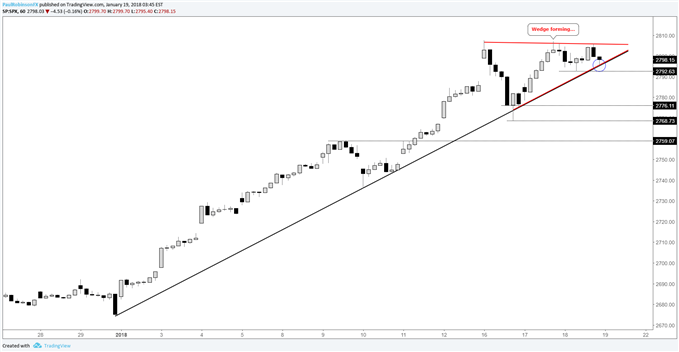
- Short-term chart (hourly) has a couple of developments worthy of watching
For intermediate-term analysis on major markets and to see the DailyFX analysts’ top ideas for 2018, check out the DailyFX Trading Guides page.
The week started with a strong gap on Tuesday following an extended holiday weekend, but the S&P 500 and other major U.S. indices quickly closed those gaps, and then some. The resulting ‘gap-and-trap’ reversal (gap which fails, catching one side of the market leaning the wrong way) also carved out what some would refer to as a ‘dark cloud cover’ candlestick. Hinting at a pullback…
However, on Wednesday we saw the market take back most of the day’s prior range and close at a new record high. It was just another sign of just how strong of a tape we’re in right now, and that one-off bearish days find little to no follow-through. Volatility is ticking higher, albeit very modestly so, and while the market climbs higher. For more on what this might mean, check out Chief Currency Strategist, John Kicklighter, and his latest S&P 500/VIX commentary.
The broad trading bias remains the same, cautiously bullish. It’s still difficult to be a buyer, though, until we see a retracement or period of consolidation. As far as shorts go, it’s an even tougher road to go down right now. At some point shorts will gain the upper-hand, but we’ll need to be patient in the meantime and take what the market presents.
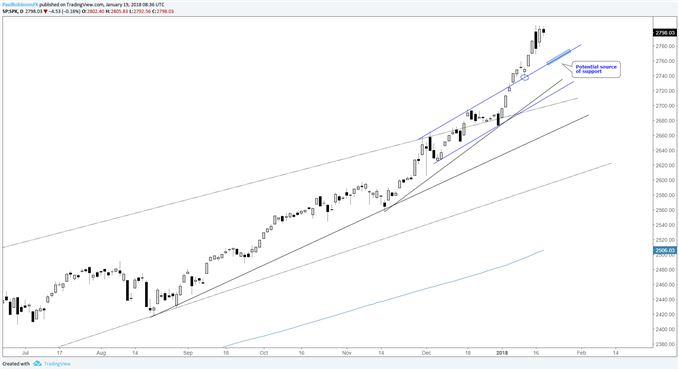
The first level (or line this case) to look to as support on the daily comes in by way of the upper parallel of the bullish channel the market carved out during December. The line in question currently clocks in around 2760. A decline and hold of this threshold may offer traders a decent spot to look for a long.
Check out these 4 methods today for Building Confidence in Trading
Chart 1 - S&P 500: Daily

The chart below is the 1-hr time-frame, showing a rising trend-line helping keep the market supported, along with resistance from days recent. Price action is wedging up between the two, a break of either top or bottom-side thresholds could lead to short-term move...
Chart 2 - Hourly

Trading Resources
Whether you are a new or experienced trader, we have several resources available to help you; indicator for tracking trader sentiment, quarterly trading forecasts, analytical and educational webinars held daily, trading guides to help you improve performance, and a guide specifically for those who are new to forex.
---Written by Paul Robinson, Market Analyst
To receive Paul’s analysis directly via email, please SIGN UP HERE
You can follow Paul on Twitter at @PaulRobinsonFX


