


Highlights
- Valuations are nearly unrivaled
- Volatility compressed to ‘generational’ levels
- At the top of the bull market channel, 5th wave of EWP cycle looks nearly completed
- Decline off highs at some point set to be steep
Get ready for 2018 by reviewing DailyFX Trading Guides designed for traders of all experience levels.
As the final days of 2017 tick away, we look ahead to what could be in store for next year. The S&P 500 has been on a tremendous run since bottoming in 2009, far exceeding most market participants’ expectations. As we enter 2018 there is reason to believe we could be in for a bumpy ride in the year ahead...
Valuation level nearly unrivaled
Valuation metrics aren’t very good for market-timing, many things aren’t. Timing market turns, especially tops, is a difficult business. But valuations can at least tell you where you may be in the cycle. There is a plethora of ways to assign a valuation to the market, most of which are very highly correlated, so by looking at one you are in many respects looking at them all. Let’s use the simple, ‘Buffett’ indicator, named after the famous investor Warren Buffett. The variation in the graph below is an updated version of the one we looked at back in April – Corporate Equities Market Cap to GDP. The only other time valuations were richer than today was at the peak of the ‘dot.com’ bubble in 2000, and considerably higher than prior to the 2008 financial crisis. This doesn’t imply the market will start melting down tomorrow, but the stage is set for a reversion to the mean in valuations at some point.
Corporate Equities Market Cap/GDP
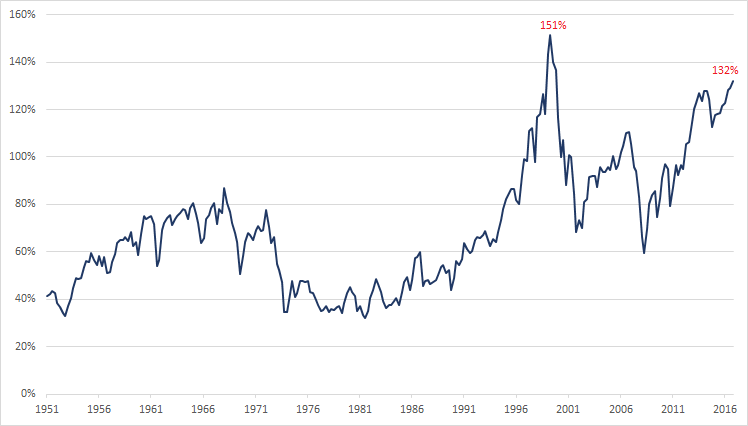
Data Source: FRED, St. Louis Fed
Volatility compressed to ‘generational’ lows
Like valuations, there are various ways to look at volatility. To put the current cycle of volatility compression into perspective, below is a graph of the rolling one-year average of monthly changes. We could have looked at the rolling 12-mo daily return profile, which is at a low not seen since the mid-1960s, but to broaden the scope and put the the current volatility cycle into an even longer-term perspective we’ve used monthly data back to 1900. Using the S&P 500 Composite index, we can see that at 1.3% the 12-month average monthly change registered in August has only occurred on a small handful of occasions over the past 117 years.
Each time following a trough, a multi-year cycle of rising volatility developed. The market can continue to rise with an increase in volatility, but in the past it has done-so with some steep set-backs along the way. The 1960s and 1990s, for example, saw rising volatility while the bull market persisted, but higher prices came with multiple double-digit percentage declines, and on a few occasions exceeding 20%. The last time we’ve seen a 20% decline from peak to trough was in 2011, and that was on an intra-day basis, not on a daily closing basis. So, it’s been awhile, looks like we might be due.
S&P 500 Composite/Rolling 1-yr avg monthly change

Data Source: www.econ.yale.edu
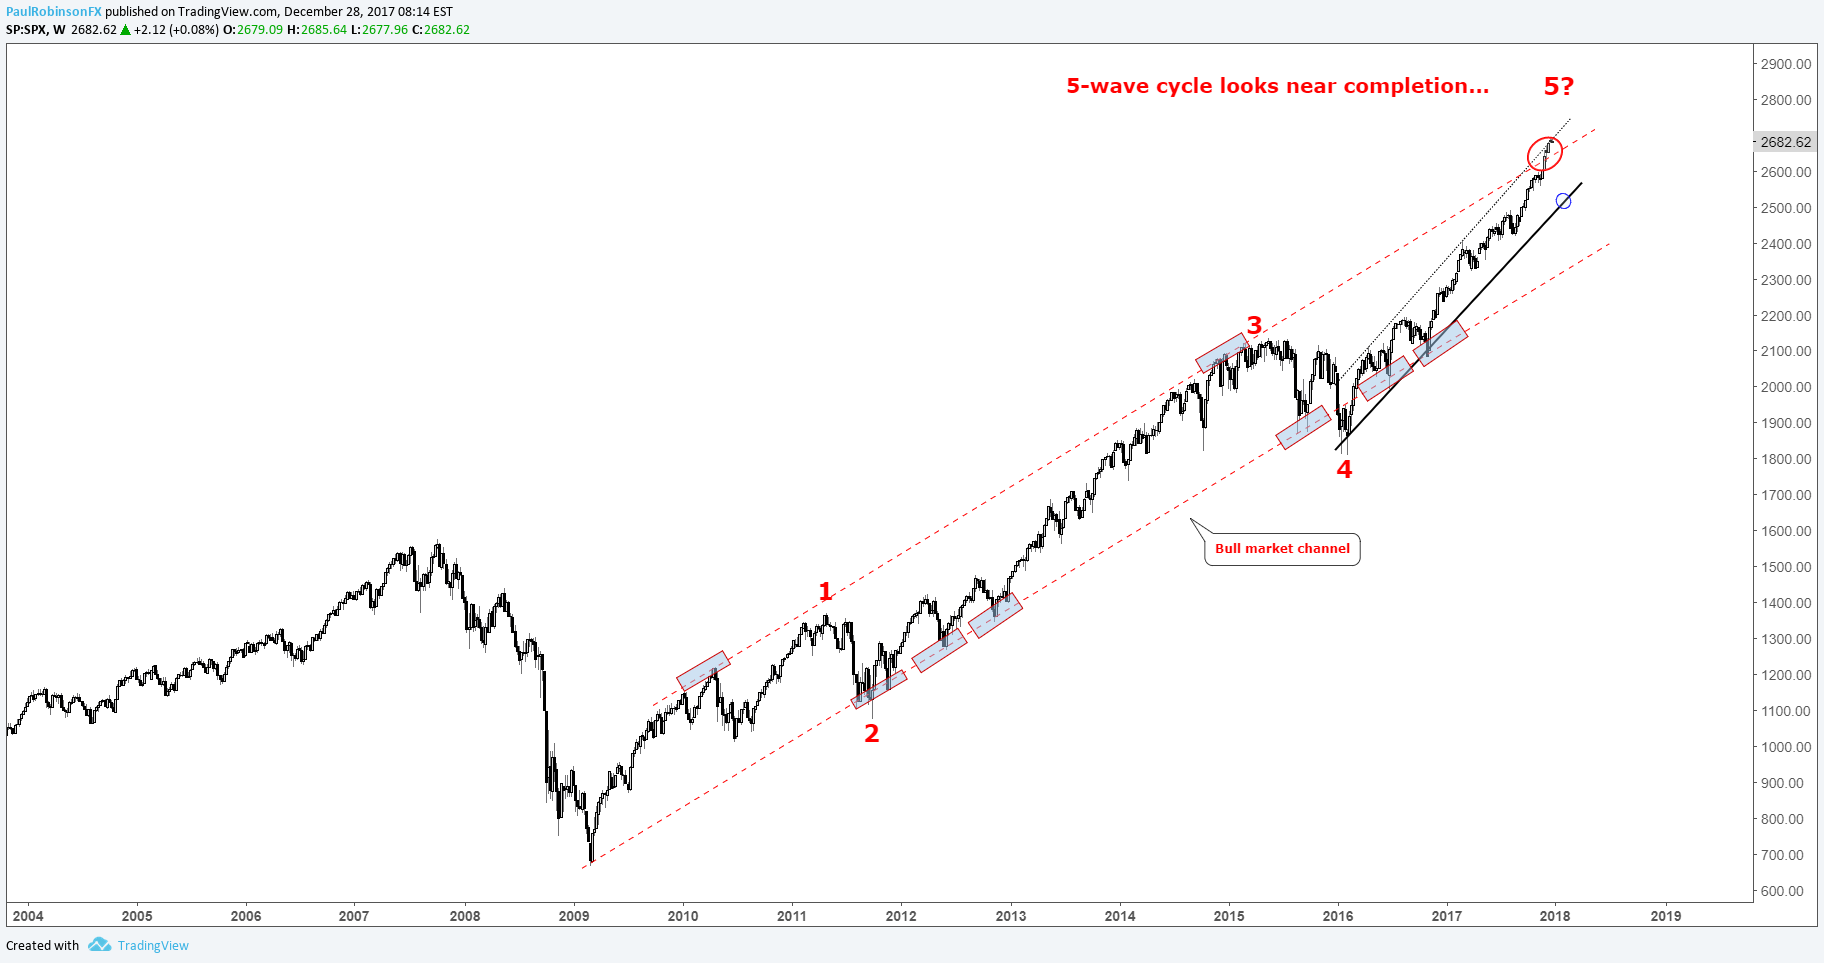
At the top of the bull market channel, 5th wave of EWP cycle looks nearly complete
In April, when we discussed the possibility of a major top forming later in the year (which has obviously passed) into 2018, we noted the Elliot-wave cycle off the 2009 low. While not a strict practitioner of Elliot Wave Principle (EWP), when a clear 5-wave cycle develops, we pay attention. The rally from the February 2016 low appears to be the final wave in clean-looking sequence, and implies that a significant top is nearing. (For more on EWP, check out Jeremy Wagner's work.)
That brings us to the bull market channel. In the spring when we looked at where the S&P could rise to before running out of steam, we looked at the upper parallel of the channel off the 2009 low. Recently, it was marginally exceeded (and now at the 2016-current upper parallel). One of two things look likely to happen here: Either very soon we see a turn lower, or one last final ‘blow-off’ rally develops before running out of gas. In either case, a major cycle top looks to be on the horizon.
S&P 500: Weekly w/Channel, EWP cycle
Decline off highs set to be steep
Looking at past declines, even during ongoing bull markets, it wouldn’t be unreasonable to think we could see a decline of greater than 20% in the year ahead. Wiping away the 5th leg of the EWP squence isn’t out of question either, and that would require a decline of over 30% from current levels. The bottom line is, the spectacular run the market has experienced looks at risk of hitting a snag of proportions we’ve yet to see since bottoming in 2009. An unwelcomed event for investors, much welcomed for traders.
---Written by Paul Robinson, Market Analyst
You can receive Paul’s analysis directly via email by signing up here.
You can follow Paul on Twitter at @PaulRobinsonFX.


