


What’s inside:
- S&P 500 rounding top formation coming into view
- Daily close below 2405 could spark down-side momentum
- Nasdaq 100 testing neckline/trend-line resistance, resume topping formation
Will the S&P 500 rise for an 8th consecutive quarter in a row? See our Quarterly Forecast here.
Last week, we described the S&P 500 as being on the “brink of a breakdown”. And while it might have staved off an immediate breakdown with a bounce on Friday and yesterday, the technical posturing is still precarious.
Dialing in on the hourly chart, the sequence of higher highs during June followed by lower highs since the peak give the market a ‘rounding top’ look. There are a couple of trend-lines to keep in mind here as the market looks to put in perhaps one more peak before turning lower. The first one is the t-line off the 6/26 peak which the market struggled with yesterday, followed by the trend-line of the record high. Stay below those and the view of topping still remains firmly in place.
S&P 500: Hourly

On a turn lower, the big level of interest for confirming a breakdown comes on a solid daily close below 2405. This is likely to set in motion a wave of selling. The slope extending upward from December may provide some support, but giving more strength to the developing topping formation and breach of 2405, the more likely scenario here is that it won’t be anything more than maybe a speedbump for shorts. The big level of interest arrives at the May low at 2352 and the February 2016 trend-line.
Daily

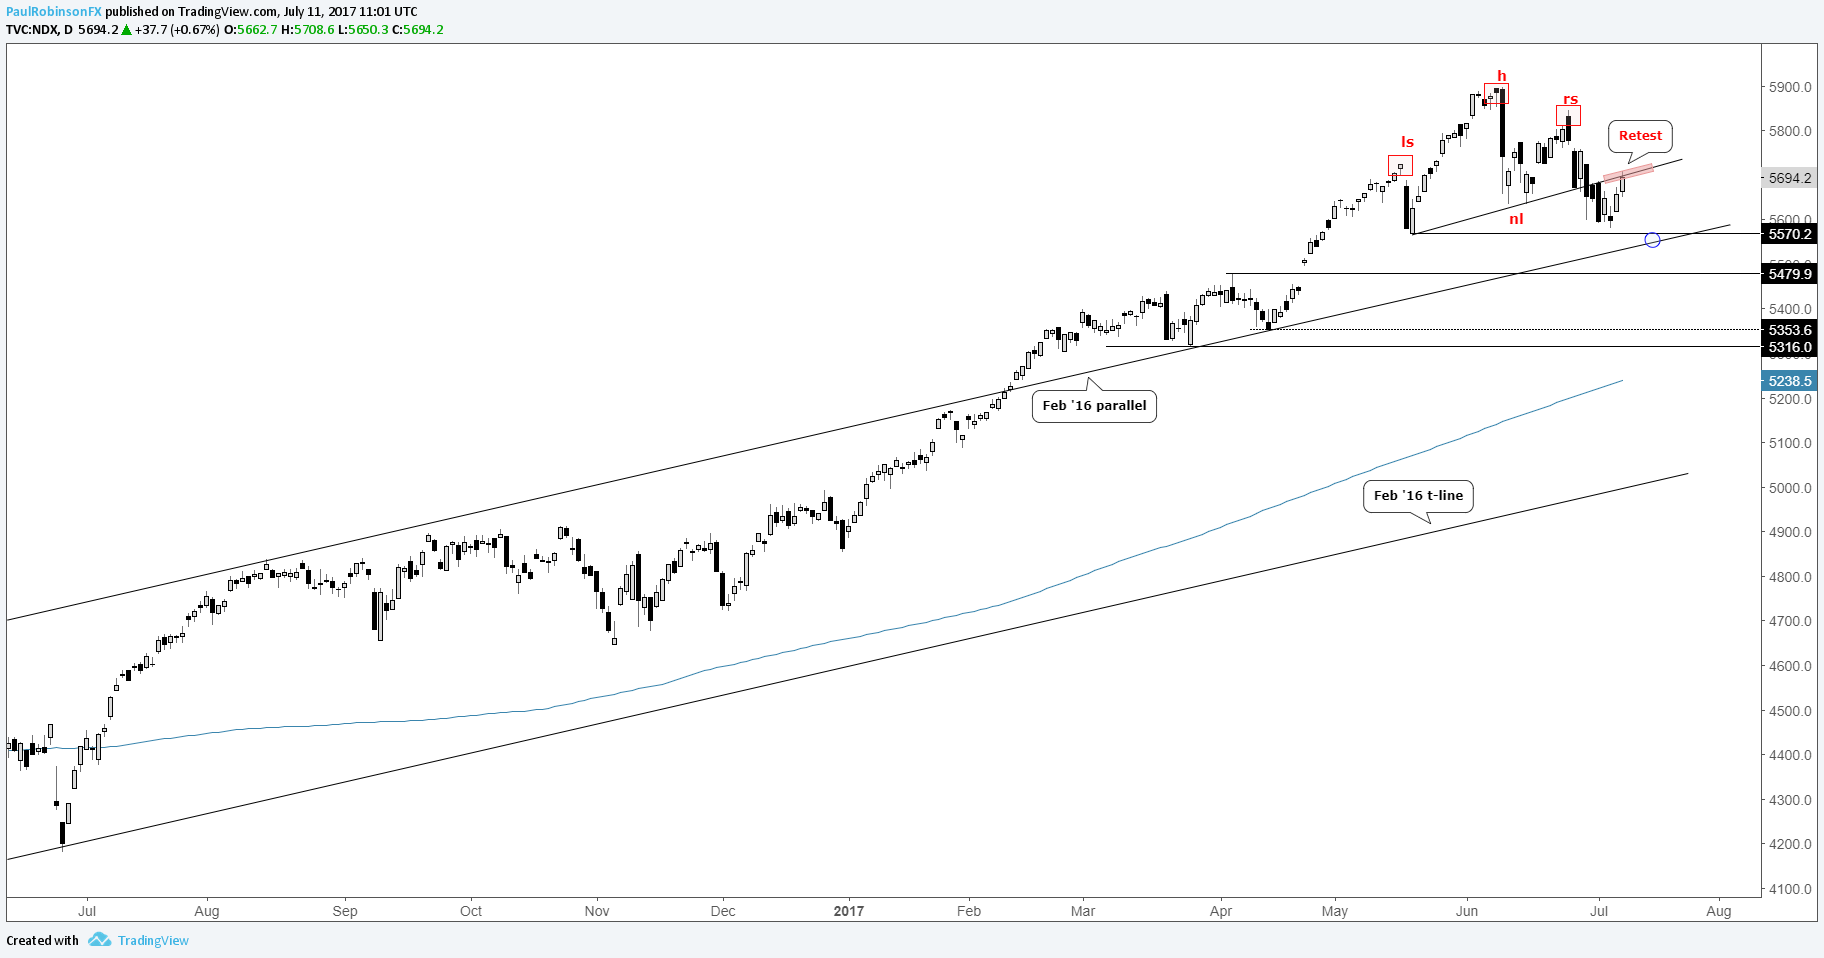
The Nasdaq 100 has a head-and-shoulders pattern underway, and while not the most symmetrical pattern with the weak left shoulder, it nevertheless does take on the look of a top. Whether you’re looking at the index through the lens of it sporting an H&S top or not, it is testing an important trend-line, or neckline. If it is to abide by this as resistance then we should see a turn lower in the next day or so. On a turn lower, the NDX will quickly visit the May low at 5570 and upper parallel to the February 2016 trend-line. A break below both support levels could set in motion an aggressive move lower.
Nasdaq 100: Daily
Paul conducts webinars every week from Tuesday-Friday. See the Webinar Calendar for details, and the full line-up of all upcoming live events.
---Written by Paul Robinson, Market Analyst
You can receive Paul’s analysis directly via email by signing up here.
You can follow Paul on Twitter at @PaulRobinonFX.


