


What’s inside:
- Be on the watch for more sudden moves like Friday’s now that election uncertainty has heightened
- Lines and levels of influence identified in choppy trading environment
- Continuing to look for fades off levels once momentum turns
Friday morning brought a decent amount of volatility to start the day, especially in the Nasdaq 100 after two of the index’s giants – Google & Amazon – reported quarterly earnings the evening before. As we headed into the afternoon it looked as though volatility might fizzle out to end the week; that is until news hit the wires that the Hillary Clinton email investigation was all but dead, thus stirring up significant uncertainty regarding the Presidential election on November 8.
Until we move past the election, we need to be on our toes as it's likely there will be more headlines to come which could cause sudden, sharp price swings. This means expect the unexpected more-so than usual and be sure to have an even tighter grip on risk.
It also means, especially given the already choppy trading environment, to expect more choppy, two-way trade, but with some bigger swings possibly thrown in. This type of market is best approached from the standpoint of a ‘fade-trader’, looking for times when momentum stalls at support or resistance and then taking the other side.
Levels and lines that matter: Friday’s move pushed the S&P 500 below the 2130 area we had penciled in as support. The short-term channel structure off the 10/24 high is keeping price pointed lower. For resistance, we will look to 2130ish and then the top-side of the 10/24 channel, broken trend-line off the 10/13 low, and broken lower parallel off the 10/17 swing low. All three lines are in the 2135/38 vicinity. Beyond there the trend-line off the 10/10 pivot and the 2146/48 zone.
On the downside, the Friday low at 2119 and lower parallel, to a lesser degree, first show up. Below 2119, the important 2115 swing low created on 10/13 will become a factor. Beyond that important low things become interesting with room to run...
Pre-market futures are near unchanged at this time, but should the market open up or below notations then those levels/lines could flip-flop their signficance (i.e. - old support becomes new resistance, vice versa.)
S&P 500: 60-min
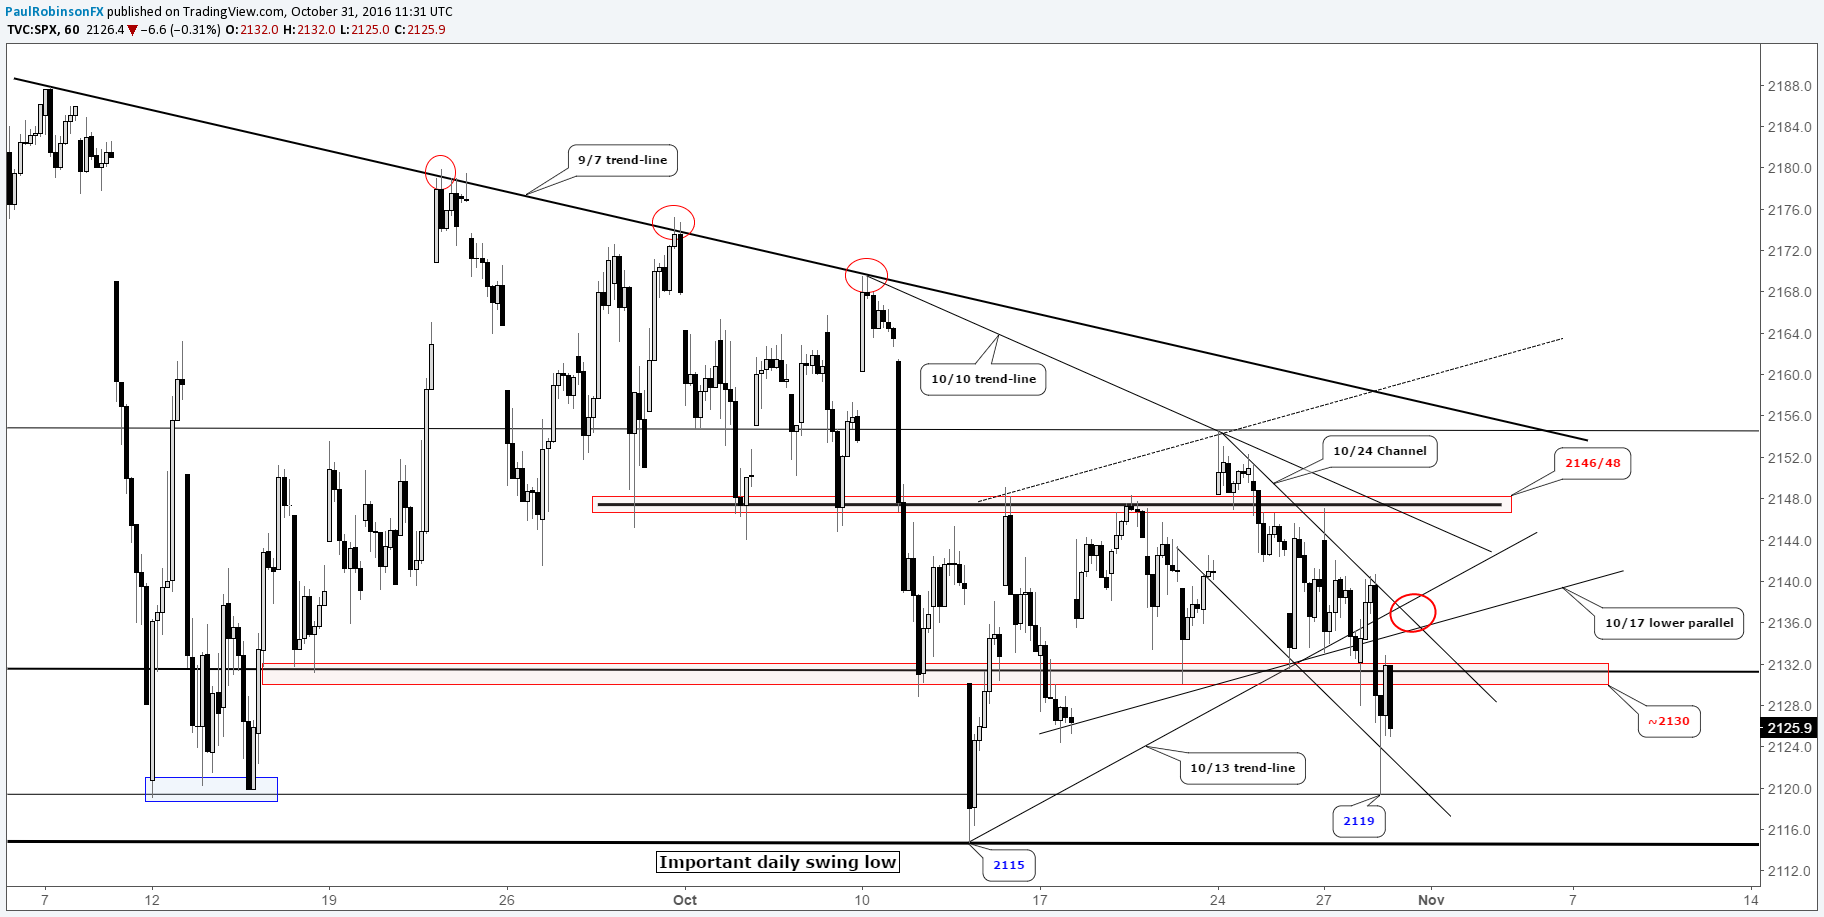
Created with Tradingview
Check out our Q4 Forecasts and Trading Guides.
---Written by Paul Robinson, Market Analyst
To receive Paul’s analysis directly via email, please sign up here.
You can follow Paul on Twitter at @PaulRobinonFX.


