


New Zealand Dollar Outlook:
- NZD/USD rates have slipped below their pandemic uptrend, while NZD/JPY rates continue to point higher.
- The difference in the performance between NZD/JPY and NZD/USD moving forward may be contingent upon USD/JPY, which is tracking US Treasury yields.
- According to the IG Client Sentiment Index, the New Zealand Dollar has a bullish bias in the near-term.
New Zealand Dollar Churning
The New Zealand Dollar is closing out the week on mixed footing, down versus four of the major currencies while gaining ground against three (incidentally, the three safe havens). While a risk-on environment has been historically beneficially for the New Zealand Dollar, and the recent change in the RBNZ’s remit makes its monetary posture more hawkish relatively speaking, the Kiwi seems to be plagued be a weakening economic environment in the near-term.
Thus far in 2021, New Zealand economic data results have deteriorated relative to analysts’ expectations. The Citi Economic Surprise Index for New Zealand has droppeda yearly high of +157.90 on February 3 to a yearly low of +63.1 by Friday, March 12. In a sense, New Zealand data has been good, just not as strong as its been, which leaves the Kiwi on mixed footing in the near-term.
As the week comes to a close, we’ll take a look at two of the major NZD-crosses, NZD/JPY and NZD/USD. NZD/USD rates have slipped below their pandemic uptrend, while NZD/JPY rates continue to point higher. The difference in the performance between NZD/JPY and NZD/USD moving forward may be contingent upon USD/JPY, which is tracking US Treasury yields.

NZD/JPY RATE TECHNICAL ANALYSIS: DAILY CHART (March 2020 to March 2021) (CHART 1)

On the daily timeframe, the recent pullback in NZD/JPY rates is insignificant; an inside day candle amid an otherwise strong uptrend. Despite the sharp pullback at the end of February, NZD/JPY rates have stabilized above the daily 5-, 8-, 13-, and 21-EMA envelope, which remains in bullish sequential order.
It’s noteworthy that NZD/JPY never dropped below the 50% Fibonacci retracement of the 2015 high/2020 low range at 76.77 during its pullback. Daily MACD has turn higher once again above its signal line, while daily Slow Stochastics are rising once more above their median line. The charts still suggest more gains are on the way.
NZD/JPY RATE TECHNICAL ANALYSIS: WEEKLY CHART (November 2014 to March 2021) (CHART 2)
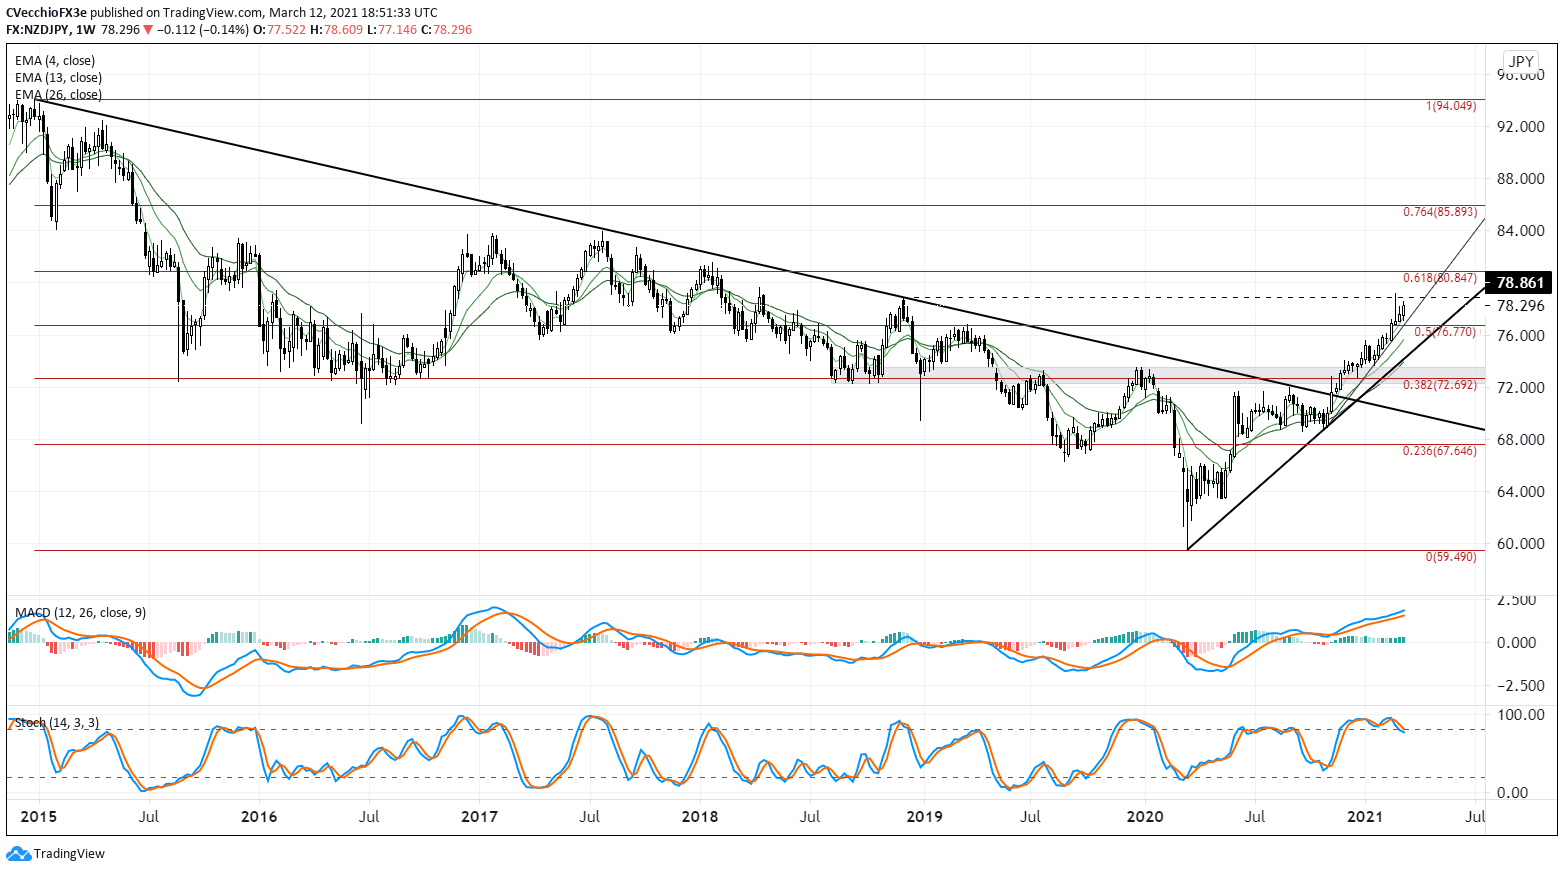
Ignoring recent noise, our outlook remains the same: “From a weekly perspective, NZD/JPY rates are on track with what is our longer-term bullish point of view: a bottoming process has commenced. NZD/JPY rates continue to trade higher following their break above the descending trendline from the January 2014, July 2017, December 2018, and August 2020 highs.
“Momentum remains bullish weekly timeframes. Rates continue to hold above the 50% Fibonacci retracement of the 2015 high/2020 low range at 76.77, while the pair is still above its weekly 4-, 13-, and 26-EMA envelope. Weekly MACD remains at its highest levels since early-2017, while weekly Slow Stochastics continue to linger in overbought territory.”
NZD/USD RATE TECHNICAL ANALYSIS: DAILY CHART (March 2020 to March 2021) (CHART 3)
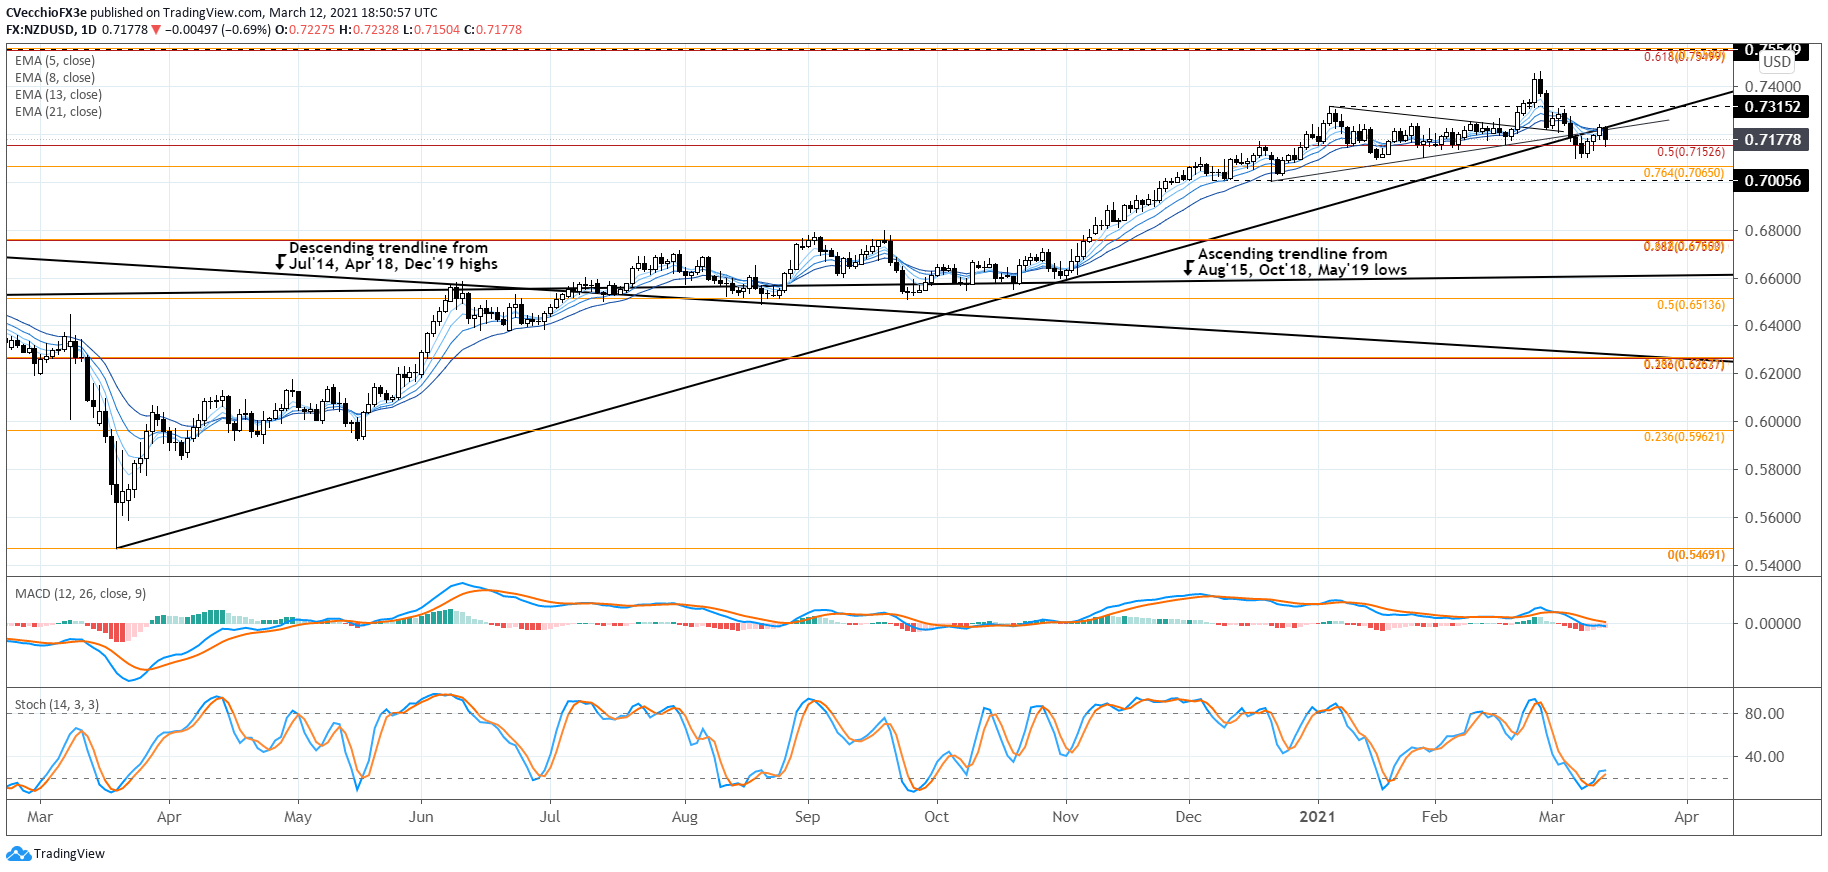
As noted previously, “if your disposition is that US Treasury yields (among others) can continue to rise, it’s likely that NZD/USD lags NZD/JPY.” This has been the environment since the prior New Zealand Dollar forecast update on March 2.
NZD/USD rates are materially weaker than their NZD/JPY counterpart. NZD/USD is below its March and November 2020 uptrend, which constitutes the pandemic trendline. The gains this week saw this uptrend serve as resistance, as did the former support in the symmetrical triangle that formed between mid-December 2020 and mid-February 2021.
Moreover, NZD/USD is still struggling to recapture its daily 5-, 8-, 13-, and 21-EMA envelope, which is nearly aligned in bearish sequential order. Daily MACD is trending lower and is nearing its signal line, but daily Slow Stochastics have rebounded from oversold territory. The indicators, while turning bearish, are not all of the same disposition, particularly with the cluster of support levels nearby: the 50% Fibonacci retracement of the 2014 high/2020 low range at 0.7153; the 76.4% Fibonacci retracement of the 2017 high/2020 low range at 0.7065; and the December 2020 low at 0.7006.
If NZD/JPY rates remains bullish, NZD/USD rates may simply be carving out an area in which they can base before turning higher; the cluster of key technical levels below suggest that ‘this’ may be the place for NZD/USD bulls to make their stand.
IG Client Sentiment Index: NZD/USD RATE Forecast (March 12, 2021) (Chart 4)
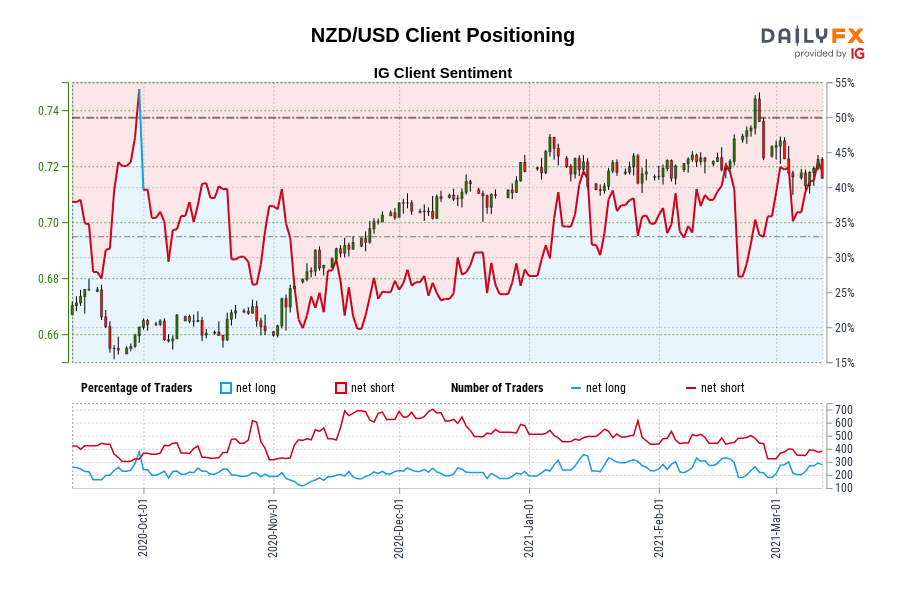
NZD/USD: Retail trader data shows 37.11% of traders are net-long with the ratio of traders short to long at 1.69 to 1. The number of traders net-long is 1.95% lower than yesterday and 16.67% higher from last week, while the number of traders net-short is 6.75% higher than yesterday and 18.94% higher from last week.
We typically take a contrarian view to crowd sentiment, and the fact traders are net-short suggests NZD/USD prices may continue to rise.
Traders are further net-short than yesterday and last week, and the combination of current sentiment and recent changes gives us a stronger NZD/USD-bullish contrarian trading bias.
--- Written by Christopher Vecchio, CFA, Senior Currency Strategist


