


Analyst Pick Overview:
- NZD/JPY rates are extending gains after breaking above the descending trendline from the January 2014, July 2017, December 2018, and August 2020 highs.
- The New Zealand economy continues to outperform the rest of the developed Western world in its handling of the coronavirus pandemic, leaving it well-positioned to take advantage of the early stages of a global growth rebound post-pandemic.
- The New Zealand Dollar has a bullish bias, according to the IG Client Sentiment Index.
The Kiwi is taking flight. NZD/USD rates are gathering bullish momentum. This is not just a USD-pair phenomenon either; JPY-crosses are experiencing significant weakness too as global risk appetite heats up. NZD/JPY rates may have a more impressive technical structure than NZD/USD rates, however. Indeed, a view of longer-term charts suggests that NZD/JPY rates may be working on a long-term bottom, setting up a potential rally that could be months – if not years – long.

NZD/JPY RATE TECHNICAL ANALYSIS: WEEKLY CHART (November 2014 to December 2020) (CHART 1)
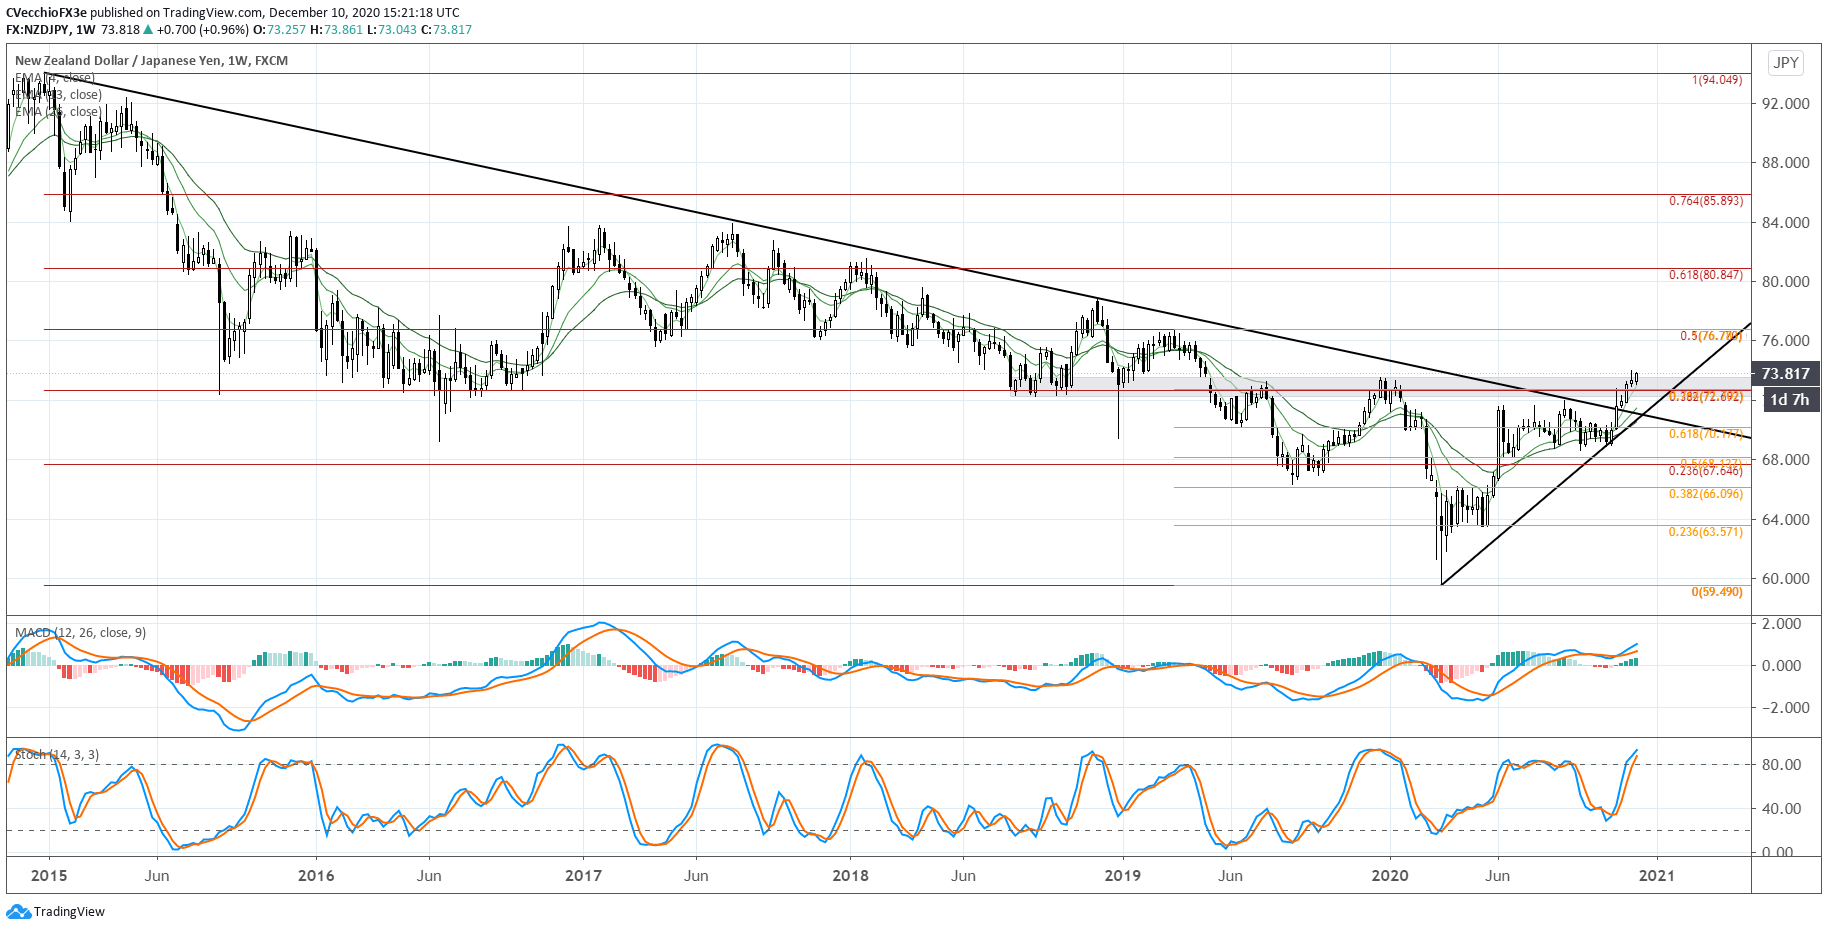
NZD/JPY rates have traded sideways in the first third of December, following the early-November breakout from the descending trendline from the January 2014, July 2017, December 2018, and August 2020 highs. The break of a multi-year downtrend constitutes a considerable attempt at establishing a long-term bottom. If a long-term bottom is being established, then we’re looking at a long-term timeframe of ‘buying the dips’ in NZD/JPY rates through the early part of 2021, if not longer.
NZD/JPY RATE TECHNICAL ANALYSIS: DAILY CHART (December 2019 to December 2020) (CHART 2)

Finding support at the daily 13-EMA like NZD/USD rates, NZD/JPY rates are back above the daily 5-, 8-, 13-, and 21-EMA, which is still in bullish sequential order. Similarly, daily MACD’s drop in bullish territory is slowing, while Slow Stochastics have reversed above their median line with a bullish crossover today.
The bullish breakout attempt’s pause through the 72.25/73.53 zone, which has been a band of both support and resistance dating back to September 2018, is unsurprising. But the latest kick higher suggests that traders should be on alert for a potential continuation higher, contingent upon a breach of the early-December high at 74.04.
--- Written by Christopher Vecchio, CFA, Senior Currency Strategist


