


New Zealand Dollar, NZD/USD, NZD/JPY, GBP/NZD – Talking Points:
- NZD/USD rates eyeing a retest of the September high after finding support at the 100-DMA.
- Ascending Channel may guide NZD/JPY higher.
- GBP/NZD poised to clamber back above the 200-DMA after carving out a Double Bottom reversal pattern.
The New Zealand Dollar’s correction lower against the haven-associated Japanese Yen and US Dollar may be at an end, as the risk-sensitive currency remains constructively perched above key chart support.
However, NZD could continue to lose ground against the politically-sensitive British Pound, after carving out a Double Bottom reversal pattern just above a psychological inflection point.
NZD/USD Daily Chart – 100-DMA Guiding Price Higher
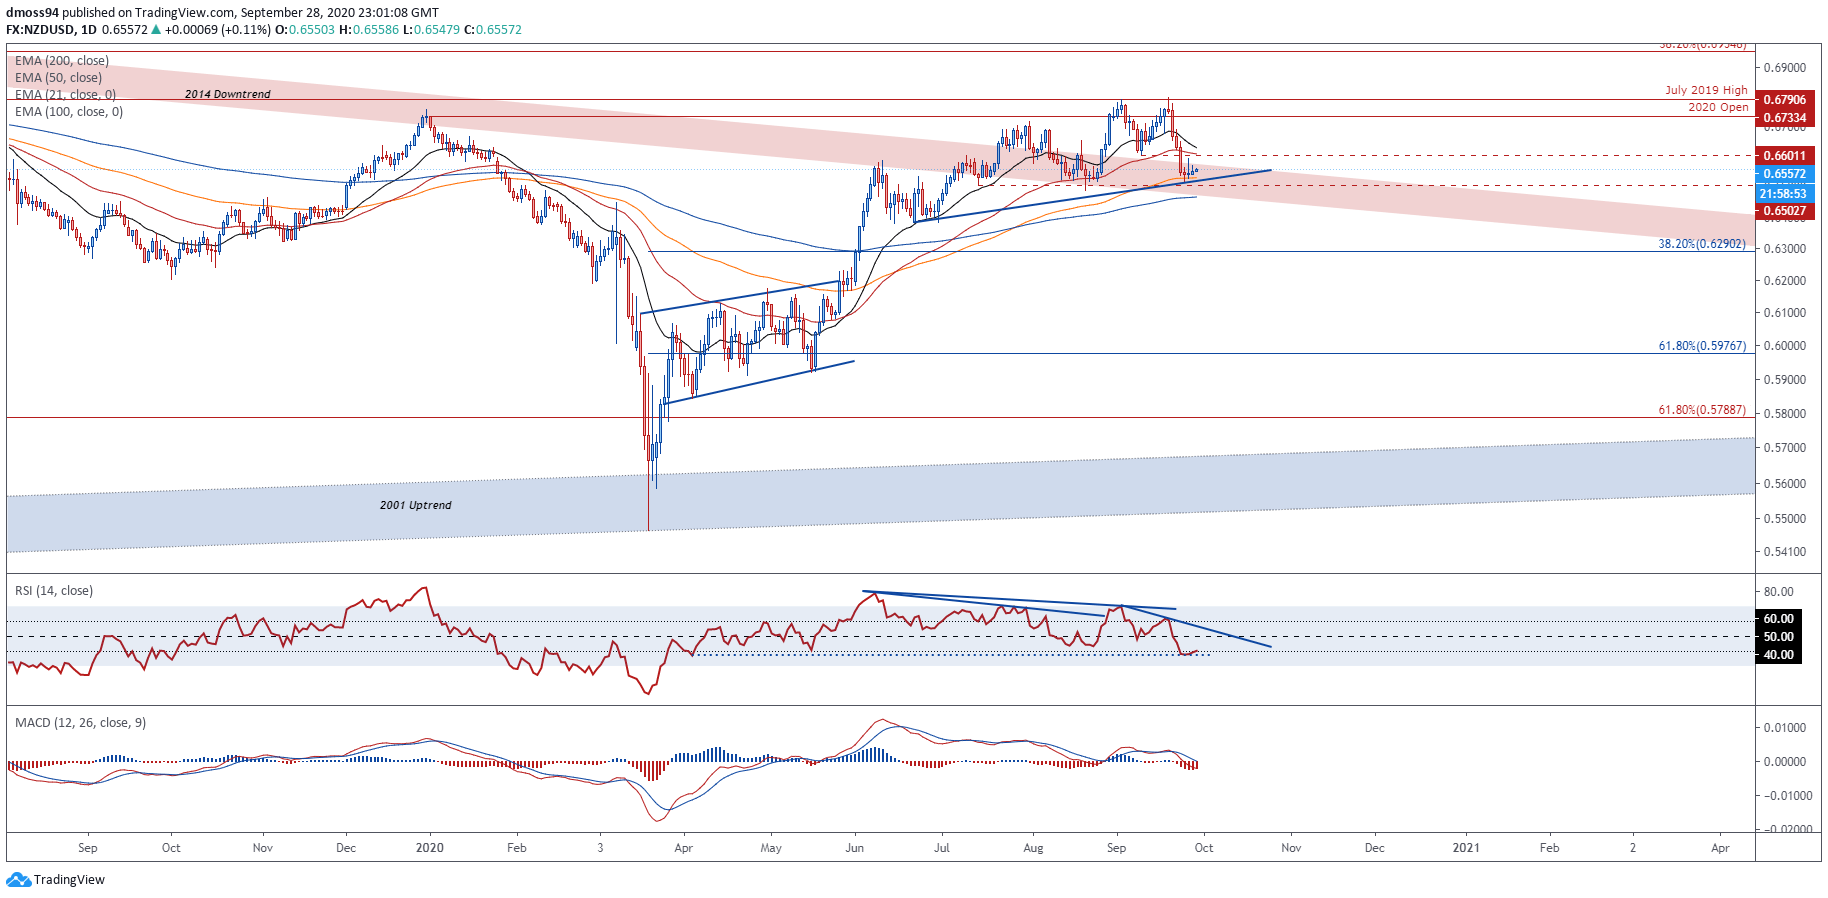
NZD/USD daily chart created using TradingView
The NZD/USD exchange rate’s 4.2% retreat from the monthly high set on September 18 (0.6798) may prove to be a mere short-term pullback, as price fails to break below the 100-day moving average (0.6529) and psychological support at the 0.6500 level.
In fact, the recent downside move appears to have validated the break above the 2014 downtrend and suggests a push back above the yearly open (0.6733) could be in the offing.
Moreover, with the RSI swerving back toward its neutral midpoint and the MACD histogram notably fading from its most extreme readings since March, the path of least resistance looks to be higher.
A daily close above the September 9 swing-high (0.6601) would probably signal the resumption of the primary uptrend and could see NZD/USD climb to fresh yearly highs, if buyers can overcome resistance at the July 2019 high (0.6791).
On the contrary, a break below confluent support at the July 14 swing-low (0.6503) and 12-week uptrend extending from the June 22 open (0.6383) could ignite a more sustained correction back towards the 38.2% Fibonacci (0.6290).
| Change in | Longs | Shorts | OI |
| Daily | 6% | -13% | 2% |
| Weekly | 40% | -35% | 15% |
NZD/JPY Daily Chart – Break Below Trend Support and 200-DMA Ominous for NZD Bulls

NZD/JPY daily chart created using TradingView
NZD/JPY’s break below the sentiment-defining 200-DMA (0.6929) and the uptrend extending from the March doldrums suggests that an extension of the 4.6% slide from the September high (71.96) could be on the cards.
However, with price continuing to track within the confines of an Ascending Channel and hidden bullish divergence seen on the RSI, a push back towards the August high (78.46) could be in the offing.
A daily close above mobile resistance at the 100-DMA (69.49) would likely invalidate the break below trend support earlier in the month and carve a path for price to retest the monthly high (71.98), if NZD/JPY can overcome the psychologically imposing 70.00 level.
Conversely, a daily close below the August low (68.76) would probably trigger a wave of further selling and could bring key support at the April high (66.16) into focus.
GBP/NZD Daily Chart – Double Bottom in Play?
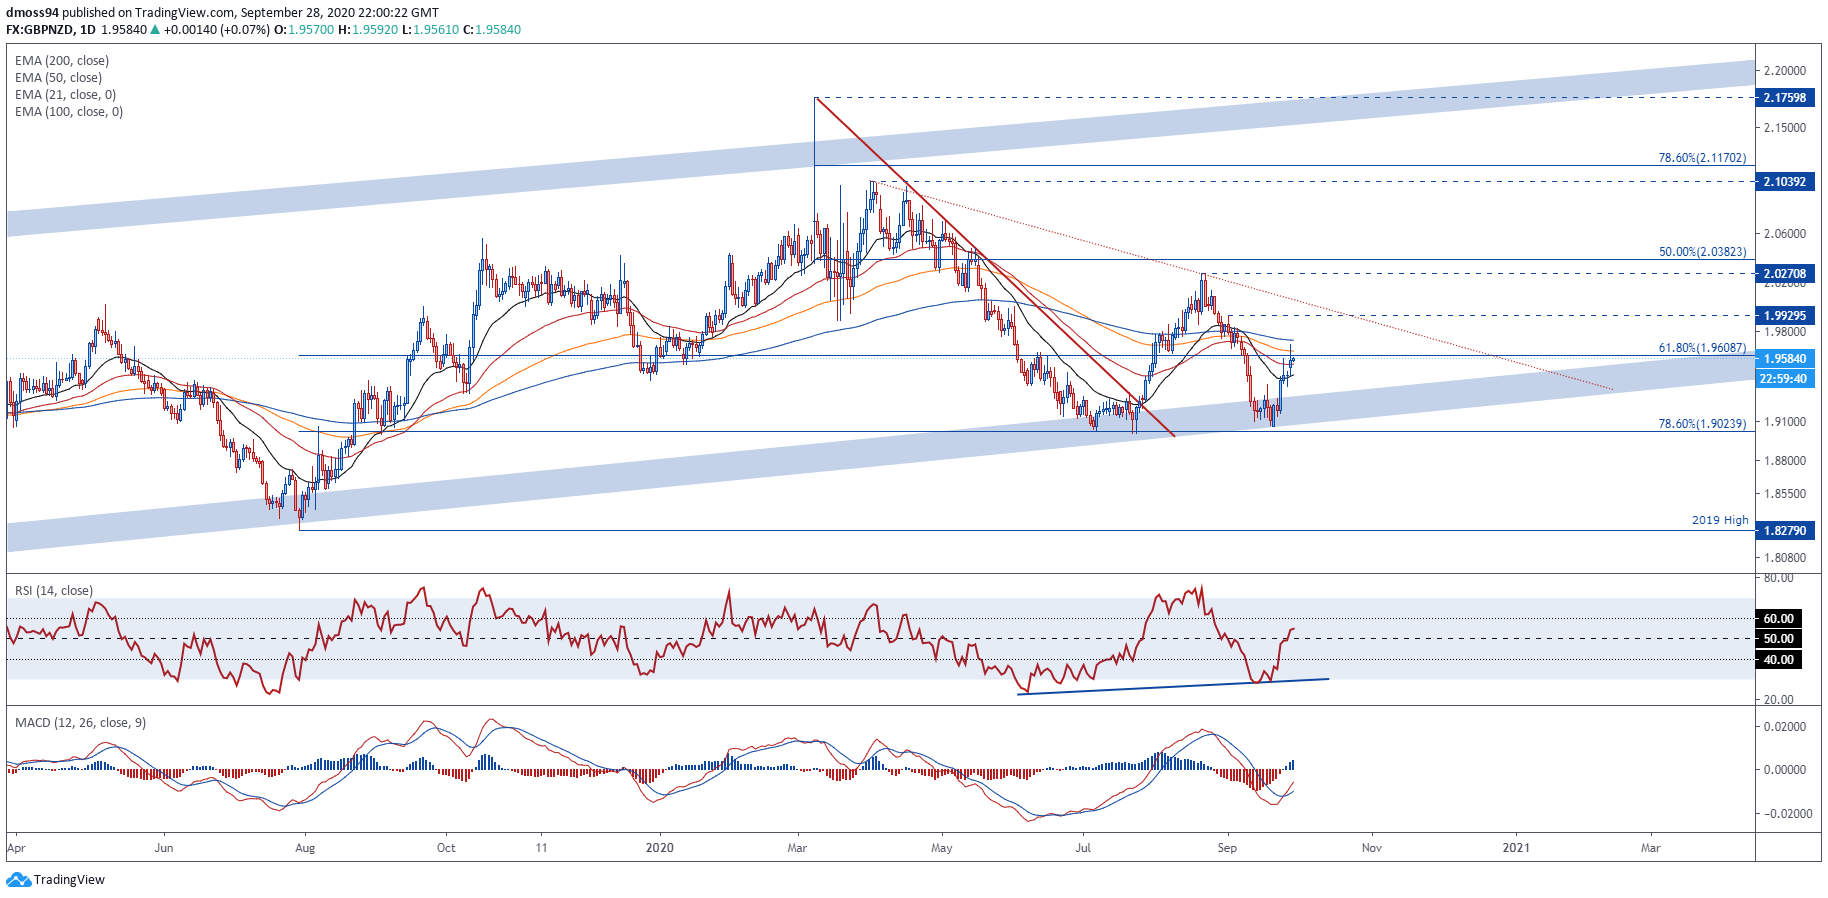
GBP/NZD daily chart created using TradingView
GBP/NZD rates could be gearing up to clamber back above the 200-DMA (1.9732), after carving out a Double Bottom reversal pattern just shy of support at the 78.6% Fibonacci (1.9024).
A surge to test confluent resistance at the September high (1.9929) and the downtrend extending from the highs of March looks likely in the coming days, if price can successfully close above the 61.8% Fibonacci (1.9608).
On the other hand, should psychological resistance at the 1.9600 mark continue to suppress buying pressure, a push back towards the monthly low (1.9055) could be on the table.
-- Written by Daniel Moss, Analyst for DailyFX
Follow me on Twitter @DanielGMoss


