


Nikkei 225 Technical Analysis Talking Points:
- The index is hovering around the first key retracement level of its most recent rise
- If it can hold here, it will have shown quite impressive resilience
- Overall global risk appetite is likely to be more decisive than the technical indicators though
Get trading hints and join our analysts for interactive live coverage of all major economic data at the DailyFX Webinars.
Fundamentally the Nikkei 225 is as maddeningly hostage to headlines emanating from this week’s US-China trade talks as every other traded asset. Technically, meanwhile it is at least showing the absolute value of Fibonacci retracement levels as key support and resistance.
Now back up to one-week highs on its daily chart, the Tokyo stock benchmark has been buoyed this week by rising hopes that at least a mini deal can be done between the two global titans in Washington. It’s important to stress that hope is all investors have so far, and that this situation may only be a single headline or Tweet away from complete reversal. That said Thursday saw the index make impressive gains, as did other risk assets.
The Nikkei is now flirting with 21,689, having made a daily close above that point on Thursday for the first time since September 30. It’s an interesting chart point, being the first, 23.6% retracement of the rise up from late August’s lows to the four-month peak of September 19.
A weekly close above that point would be tentatively constructive, keeping that top well within the bulls’ range. It would also perhaps offer the prospect that consolidation at that level could be used as a launchpad for another try at 2019s peak. That’s May 3’s 22,488.
However, we may be getting ahead of ourselves. Any return to levels above mid-September’s top is likely to be gradual and, as we have seen very vulnerable to trade news flow. Still, it will remain possible if current levels hold.
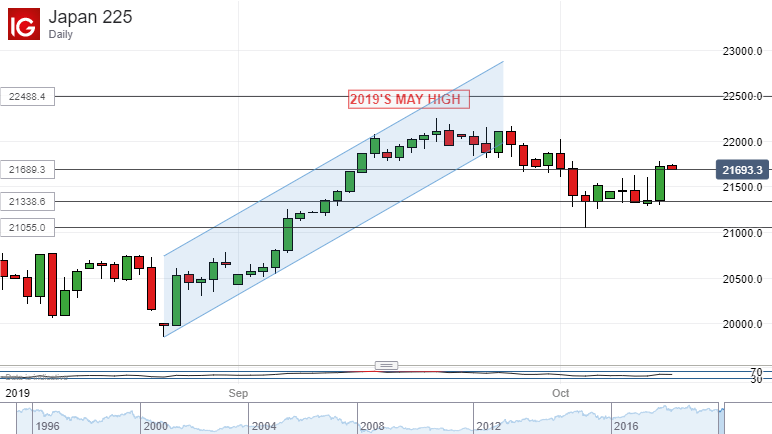
To the downside resistance still looks firm at 21,3338, the second, 38.2% retracement level. That point has effectively held of the bears on a daily closing basis for the past trading week, despite numerous attempts at it. A definitive, trade-related deflation in global risk appetite would probably see it fail, but absent that it looks solid enough.
It’s notable too that the most recent notable low, October 3’s intraday foray to 21,055, was halted at, yes, the 50% retracement level. All these clearly remain Nikkei points to watch, at least in the short term.
Nikkei 225 Resources for Traders
Whether you’re new to trading or an old hand DailyFX has plenty of resources to help you. There’s our trading sentiment indicator which shows you live how IG clients are positioned right now. We also hold educational and analytical webinars and offer trading guides, with one specifically aimed at those new to foreign exchange markets. There’s also a Bitcoin guide. Be sure to make the most of them all. They were written by our seasoned trading experts and they’re all free.
--- Written by David Cottle, DailyFX Research
Follow David on Twitter @DavidCottleFX or use the Comments section below to get in touch!


