


Talking Points
- The Nikkei was in trouble last week, it’s arguably in more now
- The year’s range has broken and a rising trendline is looking more and more vulnerable
- The bulls have an awful lot to do
Would you like to know more about financial market trading, or to get live coverage of major economic events? The DailyFX webinars are for you.
I last took a technical look at the Nikkei 225 back on March 11. It was in a spot of trouble. It was also at a point below which it could easily get into a lot more, as further falls would see 2017’s trading range conclusively broken to the downside.
There have been further falls.
In fact, the index now looks rather seriously damaged, at least from a short and medium-term technical perspective.
This is not a pretty picture: Nikkei 2225

Chart Compiled Using TradingView
As you can see the bottom of a rising channel which has been in place since the middle of last year is getting uncomfortably close. It comes it at around 17600 now, with the index itself at 18475 or so.
Then there are those averages. Admittedly the “bullish crossover” which saw the 50-day moving average top its older, 200-day brother back in October – and which heralded a 3000-point bull run – has not been reversed.
But the lines do seem to be converging at this point. Should they continue to do so a bearish crossover would be the result. That in turn would probably put all gains seen since the current rising trend took hold in grave doubt.
In short, the bulls have an awful lot of work to do, with the recapture of 2017’s previous range bases around 18738 probably their first order of business. If they can’t make that then a bearish picture probably gets more so.
PS. There is a caveat to all of the above. It gets a “PS” because it’s nothing to do with technical analysis. The Japanese economic data we’ve seen of late has not been at all bad. Trade reports speak of robust export and import surges. Business and consumer surveys reveal at least relative and, sometimes, absolute confidence.
Moreover, the Nikkei’s current weakness is surely at least in part a global response to geopolitical worries and a disinclination among investors to take undue risk now. After all, a glance at the index compared to – say – the S&P 500 shows rather similar performance. Some equity rethink has clearly been in train well beyond Tokyo.
Close enough: Nikkei 225 vs. S&P 500
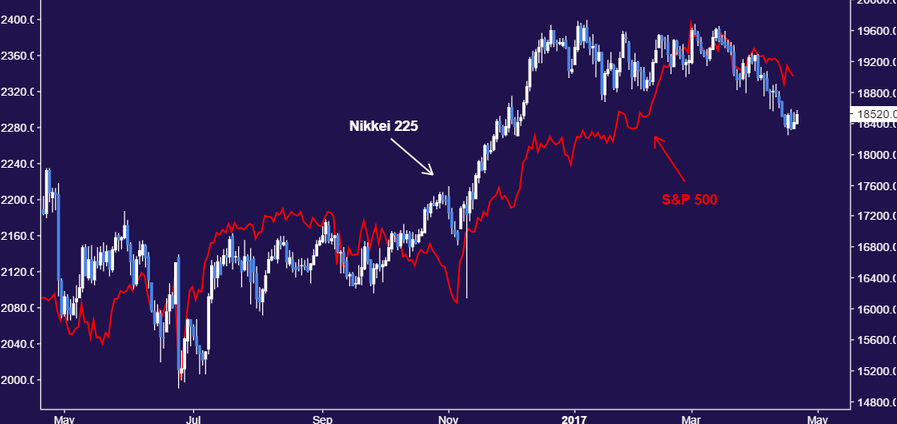
Chart Compiled Using TradingView
But a continued run of optimistic Japanese numbers suggests that there could be scope for the benchmark to regain its old heights, and maybe then some, should that global risk backdrop improve.
--- Written by David Cottle, DailyFX Research
Contact and follow David on Twitter: @DavidCottleFX


