


What’s inside:
- DAX breaks above eyed resistance zone, puts bearish outlook on hold…for now
- Alternate path lower may be developing with the formation of an H&S top
- Short-term support and resistance zones outlined
What will drive global stock markets in Q3? See our Quarterly Forecast.
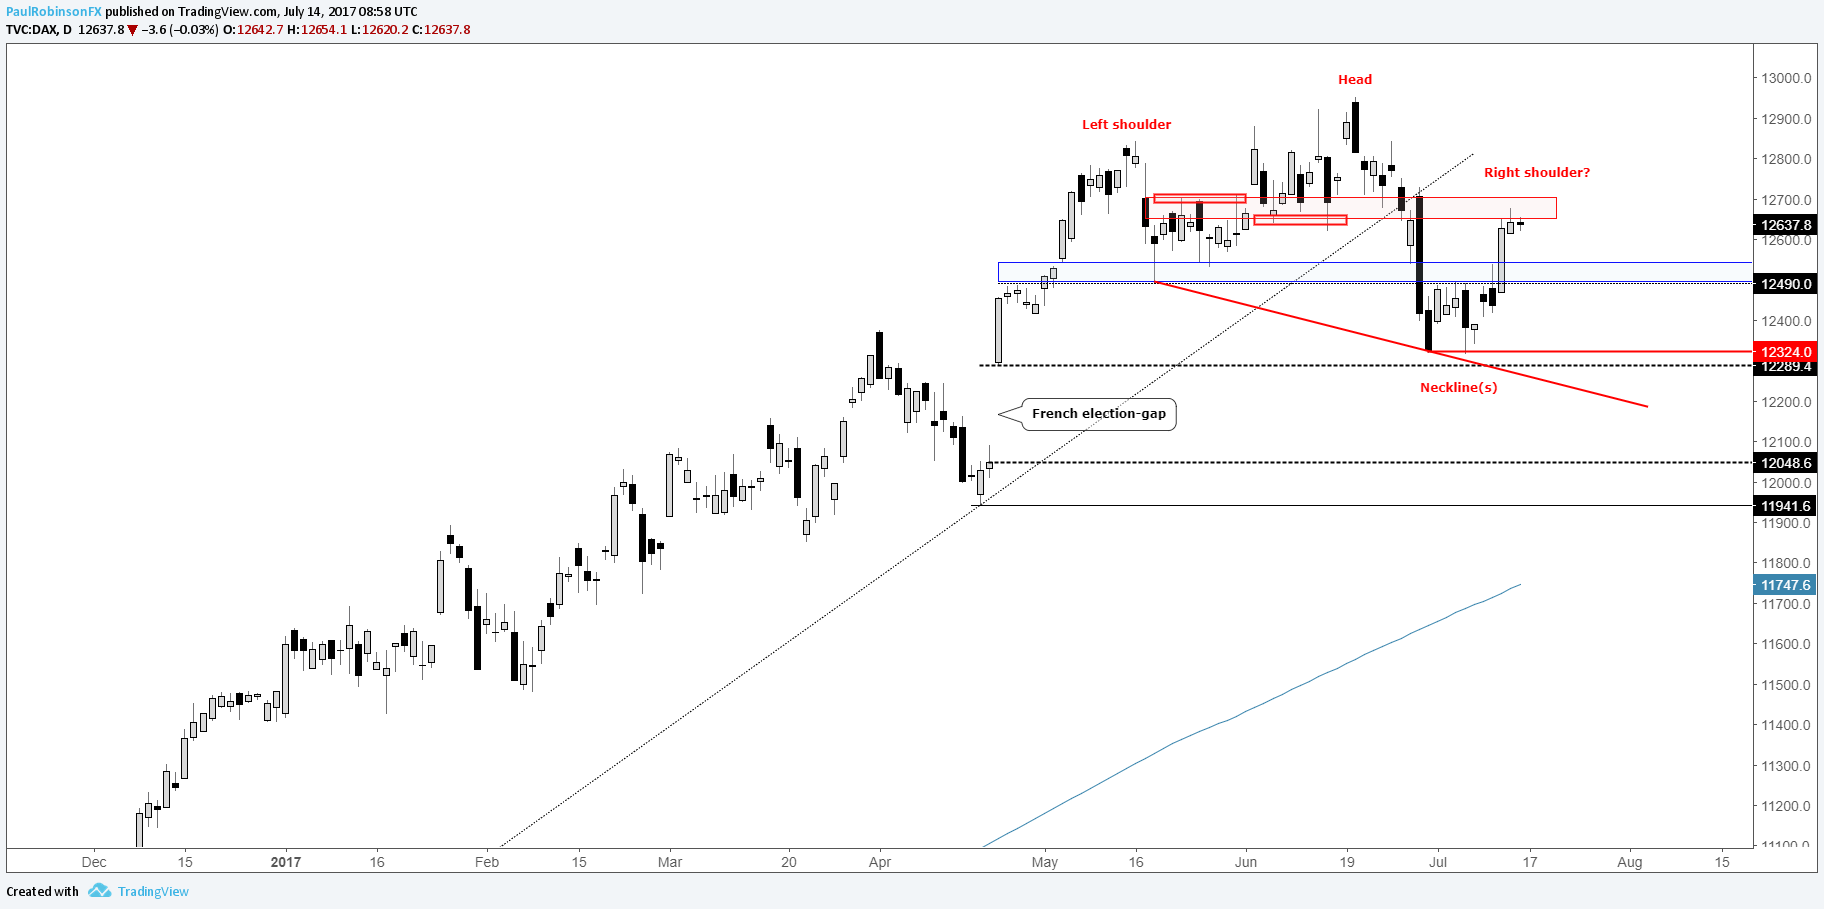
The progression of recent price action in the DAX has not played out as anticipated. On Tuesday, we said the market was set to revive a bearish tone, and that a drop into and eventual fill of the April gap was the most likely outcome over the near-term. This view remained in play as long as the DAX stayed below the zone of resistance we had penciled in at 12486/539. Wednesday’s rip pushed the index well above noted resistance, now bringing into play another level of resistance and a still potentially bearish scenario which could see the French election-gap yet become filled or worse.
The zone we are looking at now consists of the top and bottom-side of a pair of congestion periods during May and June. But the bearish scenario we are interested in at this time is the developing ‘head-and-shoulders’ (H&S) top. We have a clear left shoulder, head, and with a turn lower soon and a right shoulder could be solidified. The DAX would of course need to trade through the neckline of the formation to validate the H&S top, but it’s on the table right now. (Drawn in are two necklines; one on a lower low and the other is the more conservative ‘textbook’ way to draw it. We’ll delve more into this should it become relevant.)
To put in a right shoulder the turn down should happen soon if we are to see the pattern go from possibility to reality. If the market continues higher then we will need to consider alternate paths. In the shorter-term, resistance extends from current levels up to just over 12700, while the once-viewed area of resistance in the 12486/539 vicinity could become a source of support.
On Tuesday, in the weekly “Indices & Commodities Analysis for the Active Trader” webinar we’ll discuss developments between now and then.
DAX: Daily
---Written by Paul Robinson, Market Analyst
You can receive Paul’s analysis directly via email by signing up here.
You can follow Paul on Twitter at @PaulRobinonFX.


