


British Pound, GBP, GBP/USD Talking Points:
- GBP/USD is trading at a fresh eight-month-low after this morning’s sell-off.
- Prices are quickly approaching the 1.3500 psychological level after having taken out multiple points of support earlier today.
- The analysis contained in article relies on price action and chart formations. To learn more about price action or chart patterns, check out our DailyFX Education section.

The US Dollar charge has continued, and US Treasury Yields are continuing to rise. This has pushed GBP/USD through a key spot of support on the way to fresh eight-month-lows for the major pair. The move took out the prior swing low from July along with a confluent support zone in the 3650-3675 area. Price action in the pair is now pushing down towards another key area of potential support, around the 1.3500 psychological level.
Just below that is a confluent zone around the 50% marker of the September 2020 – July 2021 major move. Notably, this breakdown has happened, even as EUR/USD holds the line of support above the lows.
GBP/USD Daily Price Chart: Fresh Eight Month Lows
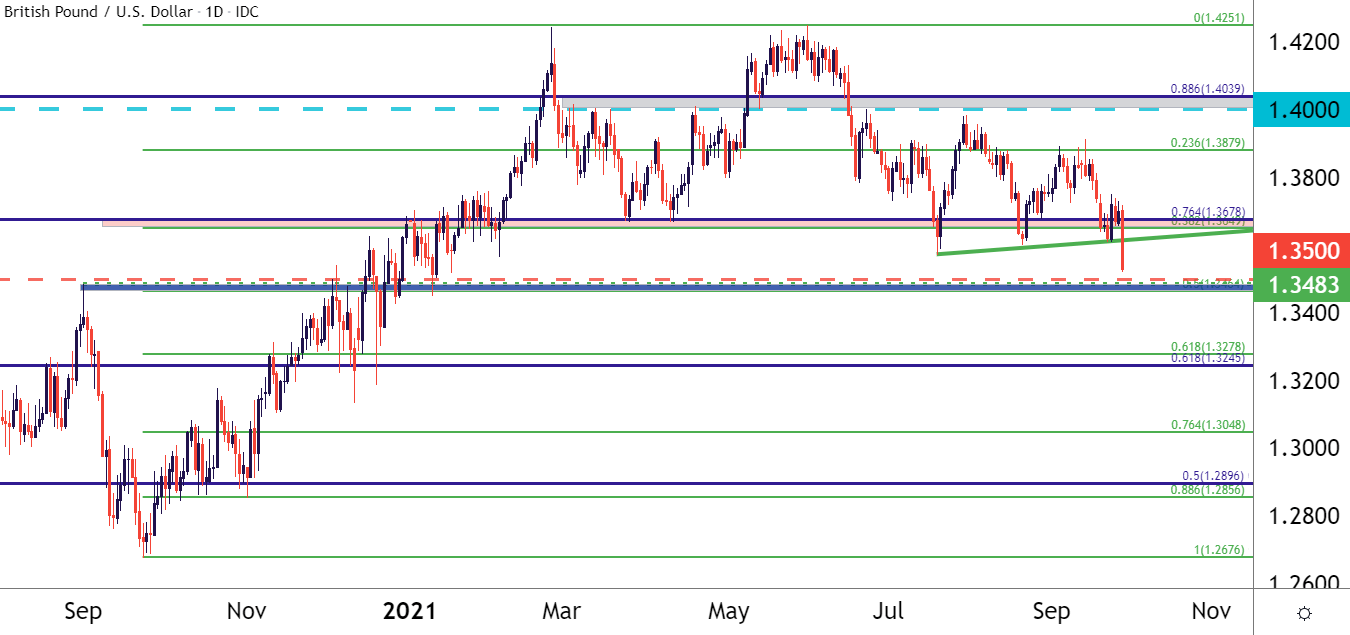
Chart prepared by James Stanley; GBPUSD on Tradingview

GBP/USD Near-Term Strategy
Given the size of the move, chasing this lower, especially when a support level is so nearby, could be a challenge. Conversely, looking at longs at this point without that support coming into play may feel akin to trying to catch a falling knife. At this point a bit of patience appears to be the more attractive way forward.
For sellers, looking for a bounce up to short-term resistance, taken from prior support, could re-open the door for momentum strategies down into that 1.3500 area. Possible resistance points exist at 1.3570 and 1.3600, swing lows from July and August.
For bulls or for those looking to fade this recent sell-off, the bounce is going to be key, particularly if the 1.3500 support test does not end up happening. Bulls may want to wait for buyers to re-claim ground above 1.3600, at which point the prior resistance zone of 1.3650-1.3675 can come into play as short-term resistance, allowing for bullish trend construction and higher-low support off of the 1.3570-1.3600 area.
To learn more about Psychological Levels, join us in DailyFX Education
GBP/USD Four-Hour Price Chart
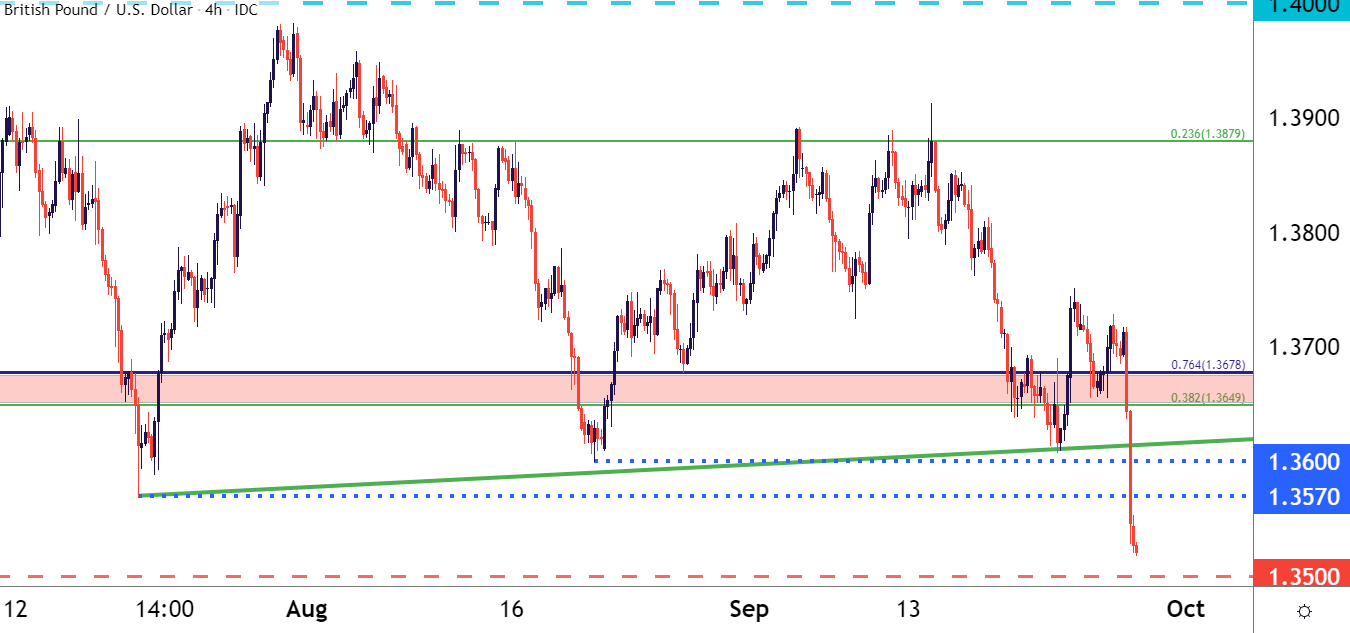
Chart prepared by James Stanley; GBPUSD on Tradingview
--- Written by James Stanley, Strategist for DailyFX.com
Contact and follow James on Twitter: @JStanleyFX


