


British Pound, GBP/USD, GBP/JPY, EUR/GBP, GBP/NZD, Technical Analysis – Talking Points:
- GBP/USD eyeing fresh yearly highs after clearing key resistance.
- Bearish RSI divergence hints at near-term pullback for GBP/JPY rates.
- EUR/GBP Double Bottom reversal pattern playing out.
- GBP/NZD on the precipice of extended losses after collapsing through multi-year support.
The politically-sensitive British Pound seems poised to push to fresh yearly highs against its haven-associated US Dollar counterpart.
However, the currency could be at risk of further losses against the Japanese Yen, Euro and New Zealand Dollar in the near term.
Here are the key technical levels to watch for GBP/USD, GBP/JPY, EUR/GBP and GBP/NZD rates.
GBP/USD Daily Chart – Yearly High Within Reach
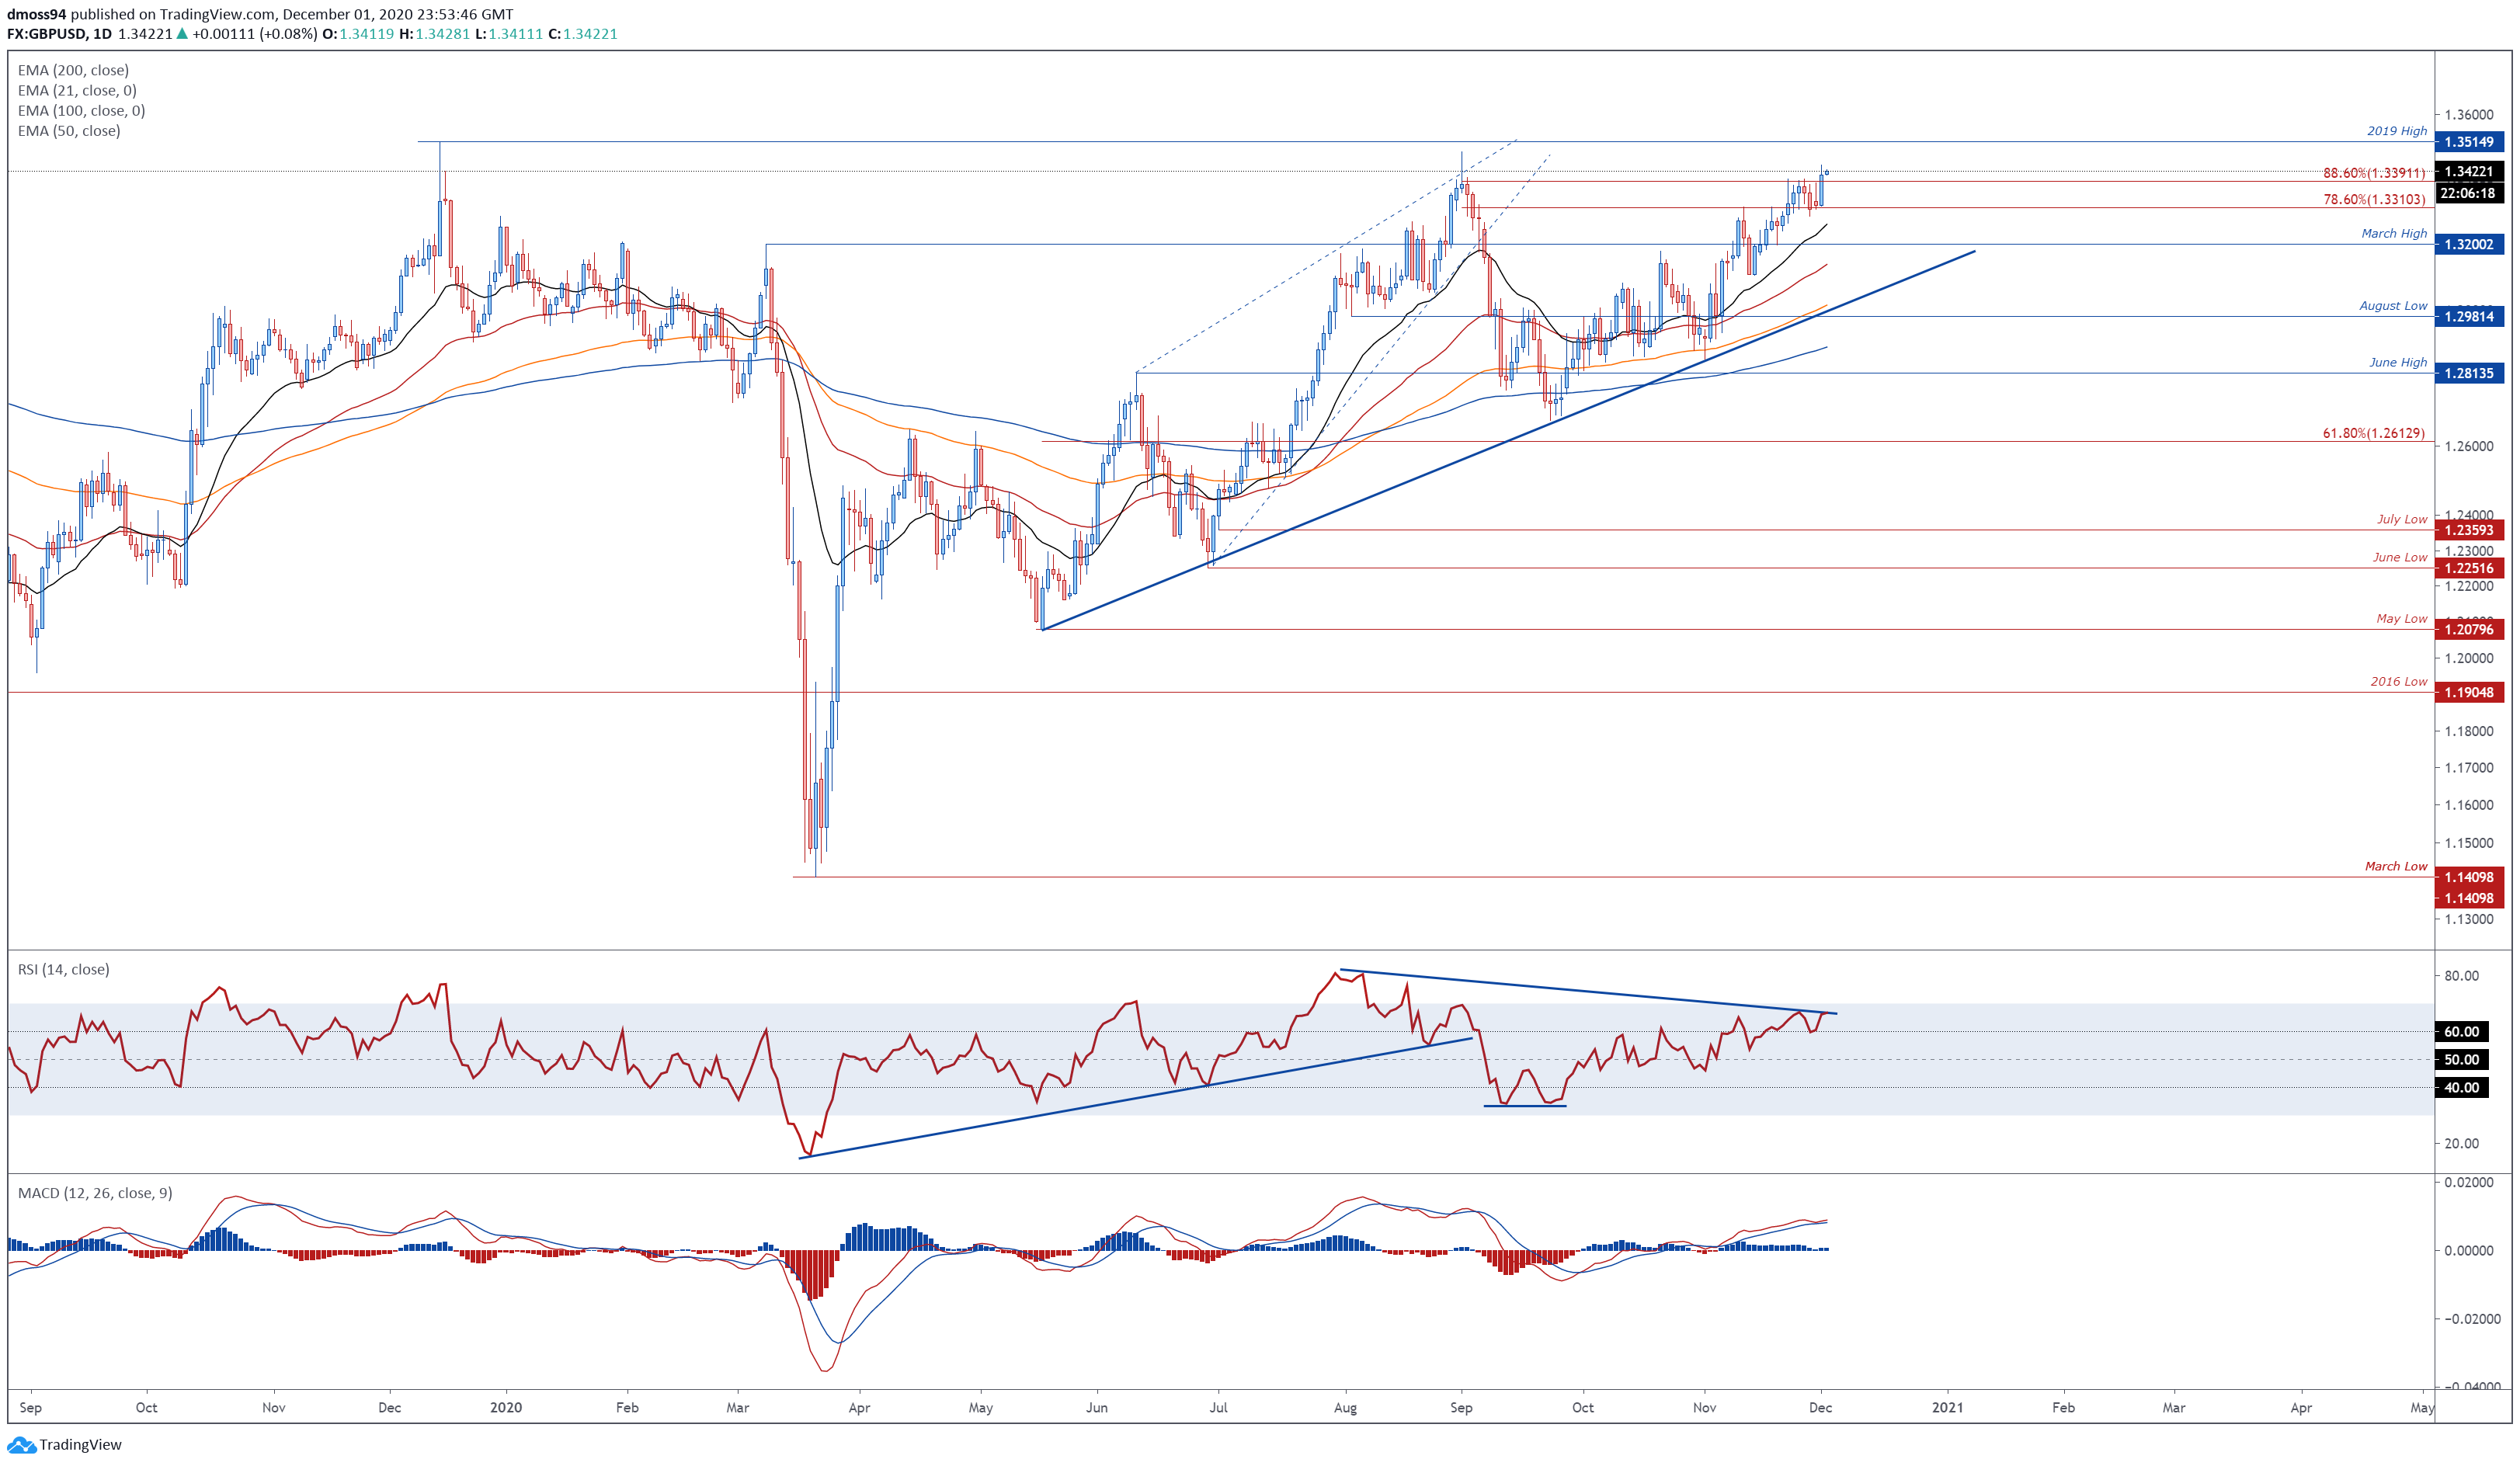
GBP/USD daily chart created using Tradingview
GBP/USD rates have stormed to within a stone’s throw of the yearly high set in September, after slicing through key resistance at the 88.6% Fibonacci (1.3391).
However, bearish RSI divergence suggests that the exchange rates’ 6% rally from the September low (1.2675) could be running out steam. The MACD histogram’s notable decline in recent days also hints a fading bullish momentum.
That being said, prices look set to challenge the yearly high (1.3483) if psychological support remain intact, with a daily close above the 2019 high (1.3515) needed to bring the 1.3600 mark into focus.
Alternatively, sliding back below the November high (1.3398) could trigger a correction back towards confluent support at the March high (1.3200) and uptrend extending from the May low (1.2079).
| Change in | Longs | Shorts | OI |
| Daily | 3% | -7% | -3% |
| Weekly | 4% | -10% | -5% |
GBP/JPY Daily Chart – Buyers Struggling at Confluent Resistance
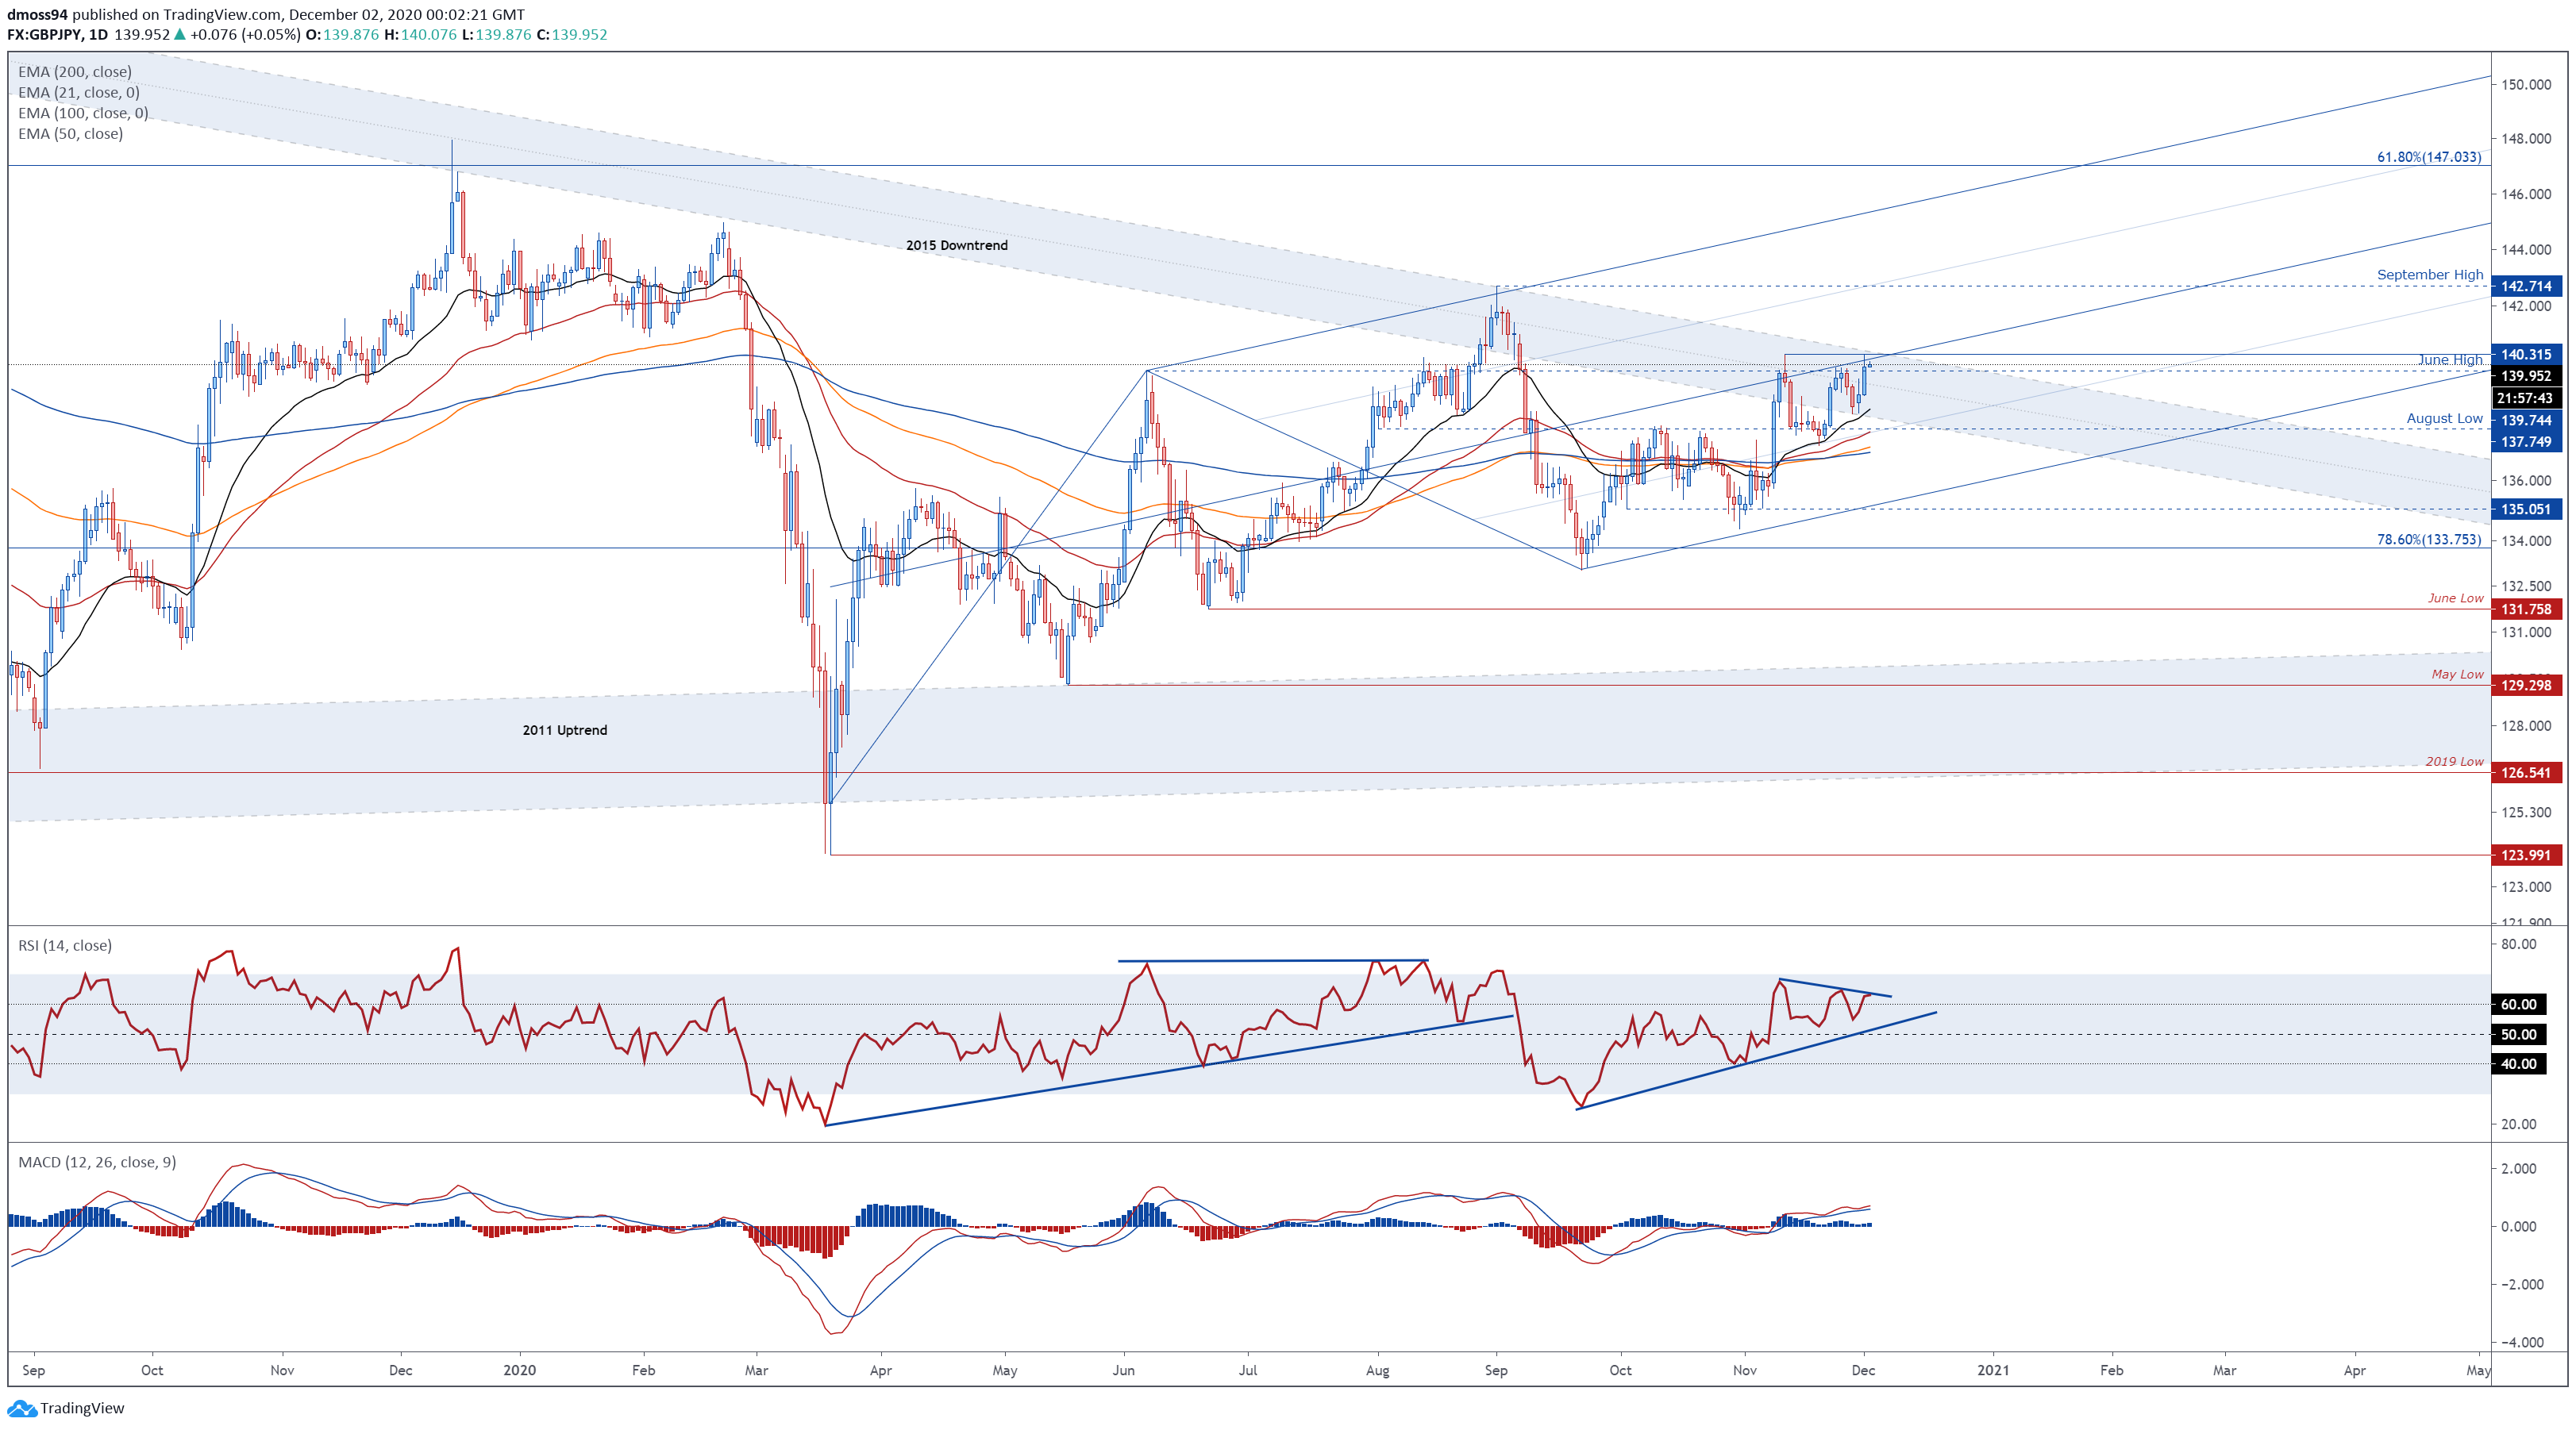
GBP/JPY daily chart created using Tradingview
GBP/JPY rates could be at risk of a short-term pullback, as buyers struggle to hurdle confluent resistance at the Pitchfork median line and November high (140.31).
Bearish RSI divergence, in tandem with a falling MACD histogram, suggests that the path of least resistance may be lower.
Nevertheless, with prices tracking firmly above all four moving averages, an extended reversal lower seems relatively unlikely.
Gaining a firm foothold above range resistance at 140.30 – 140.50 would probably neutralize near-term selling pressure and propel GBP/JPY towards the September high (142.71).
On the other hand, a break below support at the June high (139.74) may generate a downside push back towards the sentiment-defining 200-day moving average (136.96).
| Change in | Longs | Shorts | OI |
| Daily | 1% | -3% | -1% |
| Weekly | 13% | -31% | -17% |
EUR/GBP Daily Chart – Double Bottom Playing Out
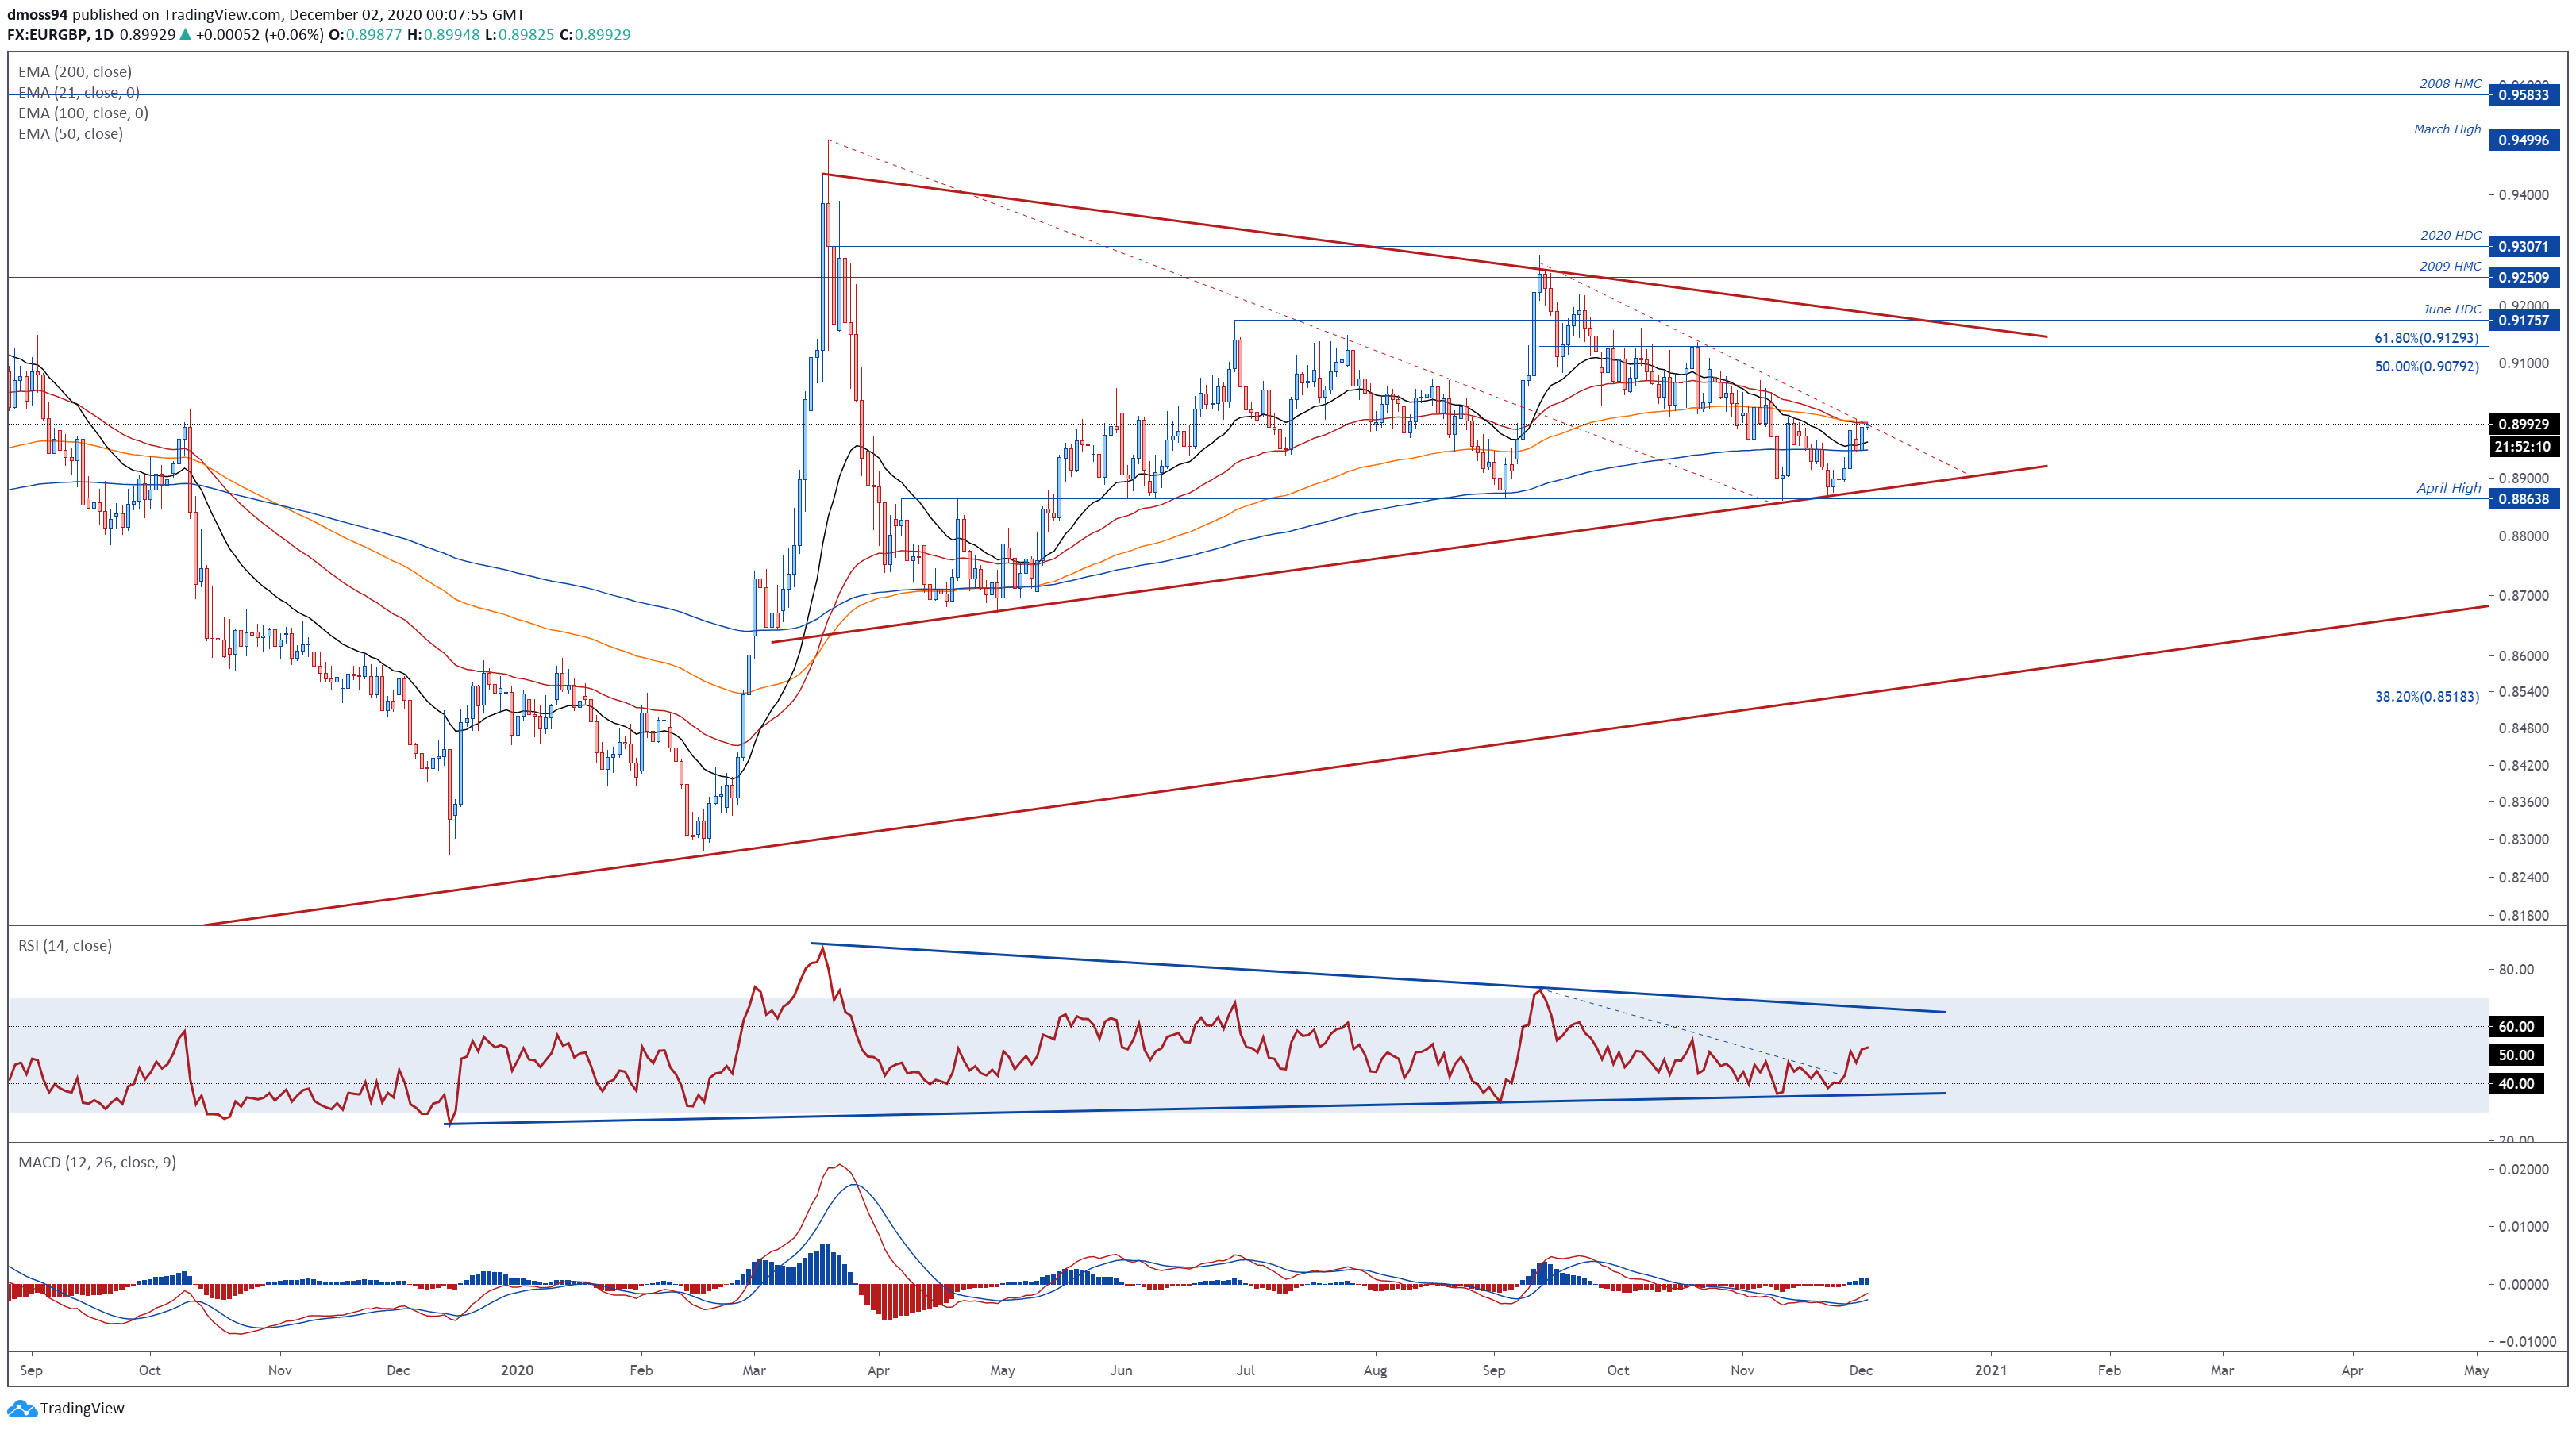
EUR/GBP daily chart created using Tradingview
EUR/GBP is attempting to pierce key resistance at the psychologically imposing 0.9000 mark, after carving out a Double Bottom reversal pattern at April high (0.8864) support.
With the RSI clambering back above its neutral midpoint and a bullish crossover forming on the MACD indicator, an extended push higher looks in the offing.
Ultimately a daily close above the trend-defining 50-DMA (0.8995) is required to validate the bullish reversal pattern and carve a path to probe a cluster of key resistance levels falling at the 50% (0.9079) and 61.8% Fibonaccis (0.9129).
Conversely, prices could slide back towards the 200-DMA (0.8948) if psychological resistance successfully suppresses buying pressure.
| Change in | Longs | Shorts | OI |
| Daily | -4% | -2% | -4% |
| Weekly | -9% | 5% | -6% |
GBP/NZD Daily Chart – Break of Long-Term Support Hints at Further Losses

GBP/NZD daily chart created using Tradingview
Finally, GBP/NZD appears to be on the precipice of extended losses, as prices collapse through 4-year Ascending Channel support and the 78.6% Fibonacci (1.9024).
Failure to clamber back above 1.9050 could trigger an impulsive downside push to retest the yearly low (1.8897) set at the end of last month.
Breaching that would probably signal the resumption of the primary downtrend and bring the 88.6% Fibonacci (1.8676) into the cross hairs.
On the contrary, a daily close back above the Schiff Pitchfork median could inspire a short-term relief rally towards the 21-DMA (1.9161).
-- Written by Daniel Moss, Analyst for DailyFX
Follow me on Twitter @DanielGMoss


