


Talking Points:
- GBP/JPY Technical Strategy: Long-Term mixed, Short-Term bearish.
- GBP/JPY tested a confluent zone of support this morning, and this can open the door to strategies on both sides of the pair.
- If you’re looking for trading ideas, check out our Trading Guides. They’re free and updated for Q1, 2017. If you’re looking for ideas more short-term in nature, please check out our IG Client Sentiment.
To receive James Stanley’s Analysis directly via email, please sign up here.
After coming into July with considerable strength, GBP/JPY spent most of the month trying to break-above the prior swing-high at 148.46. This high was set in December, just after the Fed hiked rates for just the second time in the past nine years. A subsequent top-side run in April fell short of taking out this level, and we saw this again in July as sellers set-in a ‘lower-high’ at 147.78.
But this hasn’t been an entirely one-sided story; as buyers have been responding to those retracements in the bullish move throughout 2017, and this has created an ascending wedge formation on the Daily chart of GBP/JPY.
GBP/JPY Daily: Ascending Wedge Formation
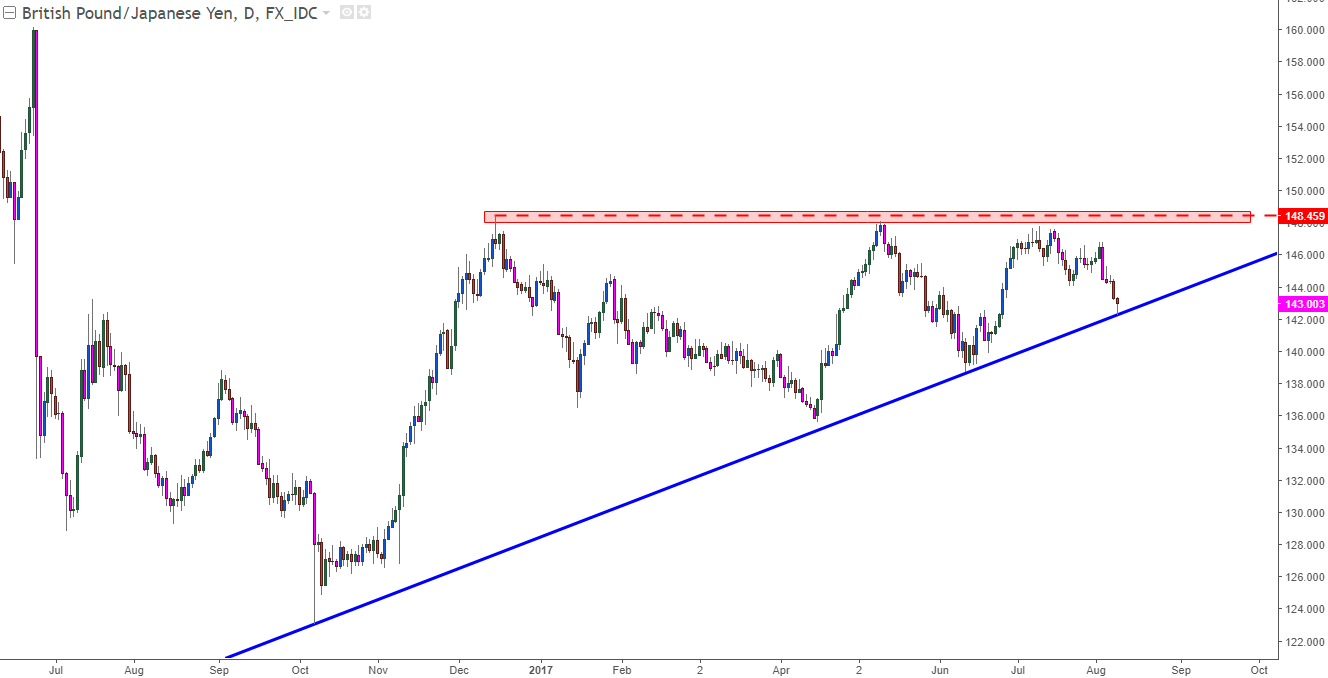
Chart prepared by James Stanley
As you can see from the above chart, current prices are in the process of testing this bullish trend-line projection. This level is confluent with the 23.6% Fibonacci retracement of the same move, taking the October 2016 low up to the December high. Perhaps more interesting: The 50% and 38.2% retracements from this same move helped to set swing-low support in April and again in June, just before buyers came-in to take control of the situation.
GBP/JPY Daily: Current Support at 23.6% Retracement, 38.2% and 50% Prior Swing-Lows

Chart prepared by James Stanley
This would leave GBP/JPY in a bullish position with the prospect of trend continuation as, at least at this point, prices remain above support and this can be an ideal anchor-point for bullish exposure.
However, as we discussed this morning, it appears as though we’ve seen the initial peek of risk aversion begin to show in global markets. If we do see a continuation of this theme, as driven by concerns around North Korea’s continued nuclear ambitions, GBP/JPY could potentially put in a dramatic down-side break. The British Pound is relatively weak after last week’s BoE meeting, and the Japanese Yen could see continued strength on the build of jitters around potential trouble in Asia.
For those that want to look at bearish strategies in GBP/JPY, they’d likely want to wait for a bit more information before looking to push that theme. A down-side break could open the door for bearish exposure, as bears taking control and driving below this morning’s swing-low of 142.24 could signal more pain ahead. Conversely, traders can look for ‘lower-high’ resistance below the prior swing-low of 144.00. If prices break-above 144.00, the bearish thesis will no longer look attractive, and traders would likely want to re-shift compasses back-towards a bullish direction.

Chart prepared by James Stanley
--- Written by James Stanley, Strategist for DailyFX.com
To receive James Stanley’s analysis directly via email, please SIGN UP HERE
Contact and follow James on Twitter: @JStanleyFX


