


Talking Points:
- Risk aversion has begun to show in global markets over the past 24 hours.
- The apparent driver of this move has been comments from U.S. President Donald Trump, in reference to the building nuclear threat from North Korea.
- If you’re looking for trade ideas, check out our Trading Guides. And if you’re looking for shorter-term ideas, please check out our IG Client Sentiment.
To receive James Stanley’s Analysis directly via email, please sign up here.
The big item across capital markets over the past 24 hours was a set of comments from U.S. President, Donald Trump. In response to the building nuclear threat out of North Korea, President Trump said that the DPRK’s nuclear threats would be met with ‘fire fury and, frankly, power the likes of which this world has never seen’. This set off a cascade effect of risk aversion throughout global markets, with U.S. equities falling-lower on the heels of those comments, and weakness continuing into the Asian and Euro sessions on the morning.
The S&P 500 has fallen-down to prior support around 2,460, the Nasdaq 100 has done the same, moving down to a zone of support that held the lows for the prior two weeks. Risk aversion has shown in FX-land, with the Japanese Yen being the big-mover, as we’ve seen USD/JPY, EUR/JPY and GBP/JPY all fall below key support levels over the past 24 hours.
USD/JPY Falls Below 110.00, Sets Fresh Two-Month Low
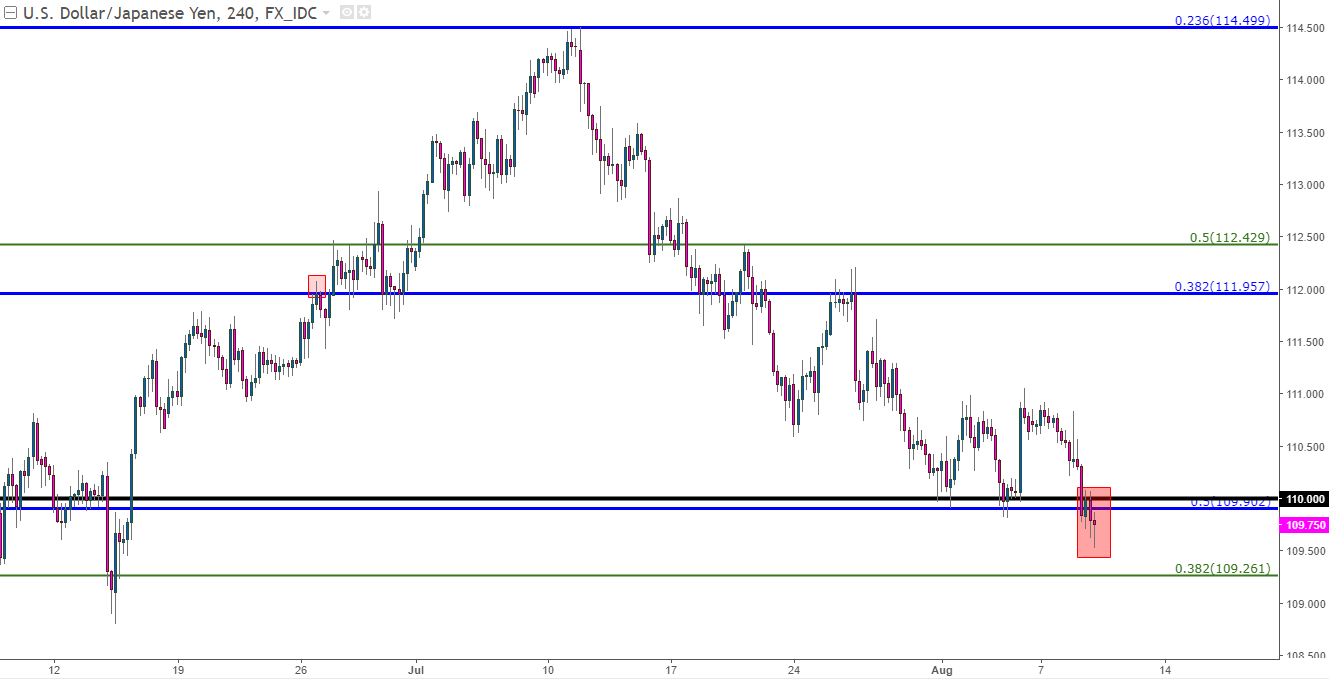
Chart prepared by James Stanley
The big question at this point is whether this is the start of a new move that may turn out to be rather nasty for risk markets; or if this is another ‘buy the dip’ type of opportunity? This question would basically be trying to predict the behaviors of Donald Trump and Kim Jong-Eun, which can be challenging to say the least. So, rather than taking a wild guess at this early stage of the matter; we’re going to look at scenarios on both sides.
Below, we’re looking at two different JPY-pairs that could offer setups for either scenario. For traders looking to fade this recent bout of risk aversion, EUR/JPY could offer attractive upside potential, while those looking to trade a continuation of risk aversion can look to GBP/JPY for such exposure.
EUR/JPY
The Euro has been a freight train for much of the year as markets have attempted to front-run the European Central Bank’s stimulus exit. With a key ECB meeting on the schedule for the first week of September, expectations have been building that we might see the bank offer some sort of strategy or plan for how this might be done.
EUR/JPY jumped by more than 1,600 pips as this theme was getting priced-in since mid-April. In mid-April, we saw the first round of French elections resolve with a rather market friendly outcome. This was a potential risk that the ECB had to keep under consideration, but after this risk abated markets began to price-in increasingly strong odds of an inevitable stimulus exit from the ECB, and this created sharp top-side move in EUR/JPY.
After initially peaking above the 130.00-level in early-July, support began to show-up around a key Fibonacci level at 128.52. This is the 38.2% retracement of the ‘Abe-nomics’ move in EUR/JPY, and the 61.8% retracement of this same move helped to set support in April just before the top-side ramp got underway.
EUR/JPY Weekly: Current Support at 38.2% Retracement of ‘Abenomics’ Move
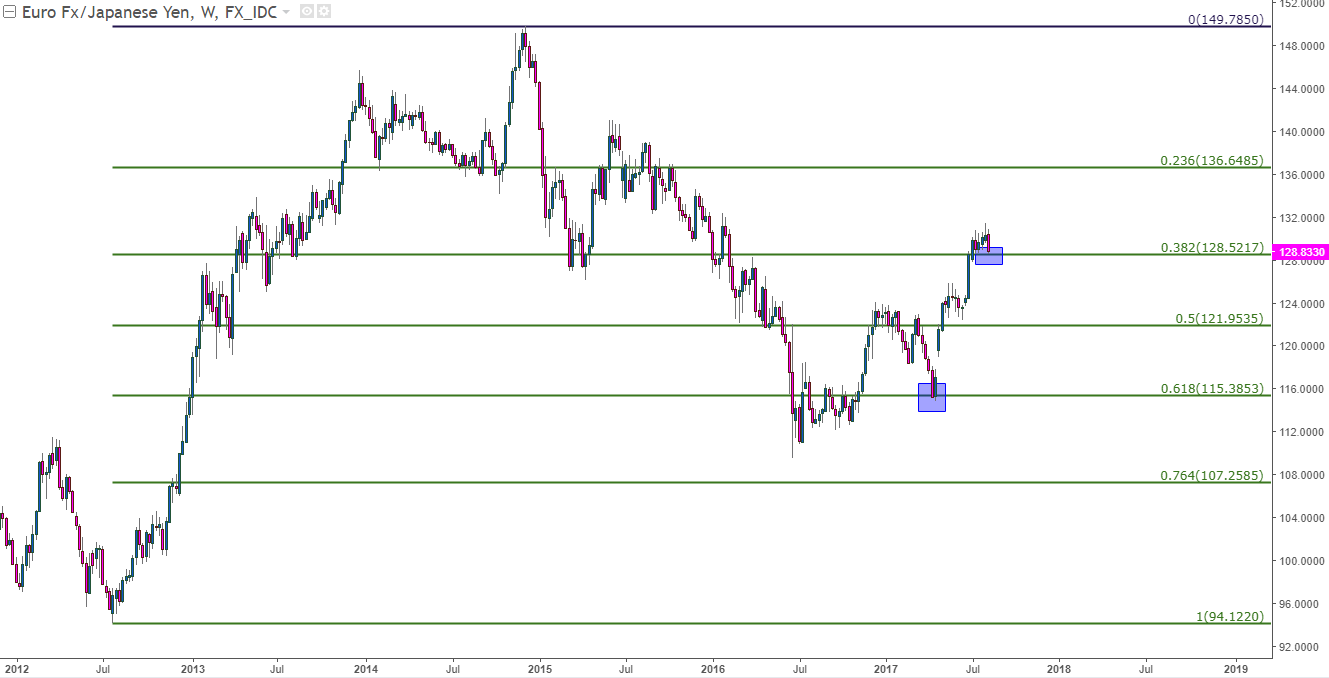
Chart prepared by James Stanley
On the chart below, we’re looking at three potential support levels that can be usable for such an approach. Given the rather extreme top-side push seen in the pair over the past four months, traders would likely want to ensure that support is actually showing at each of these levels before looking to take on long exposure.
EUR/JPY Four-Hour with Potential Support Levels Applied
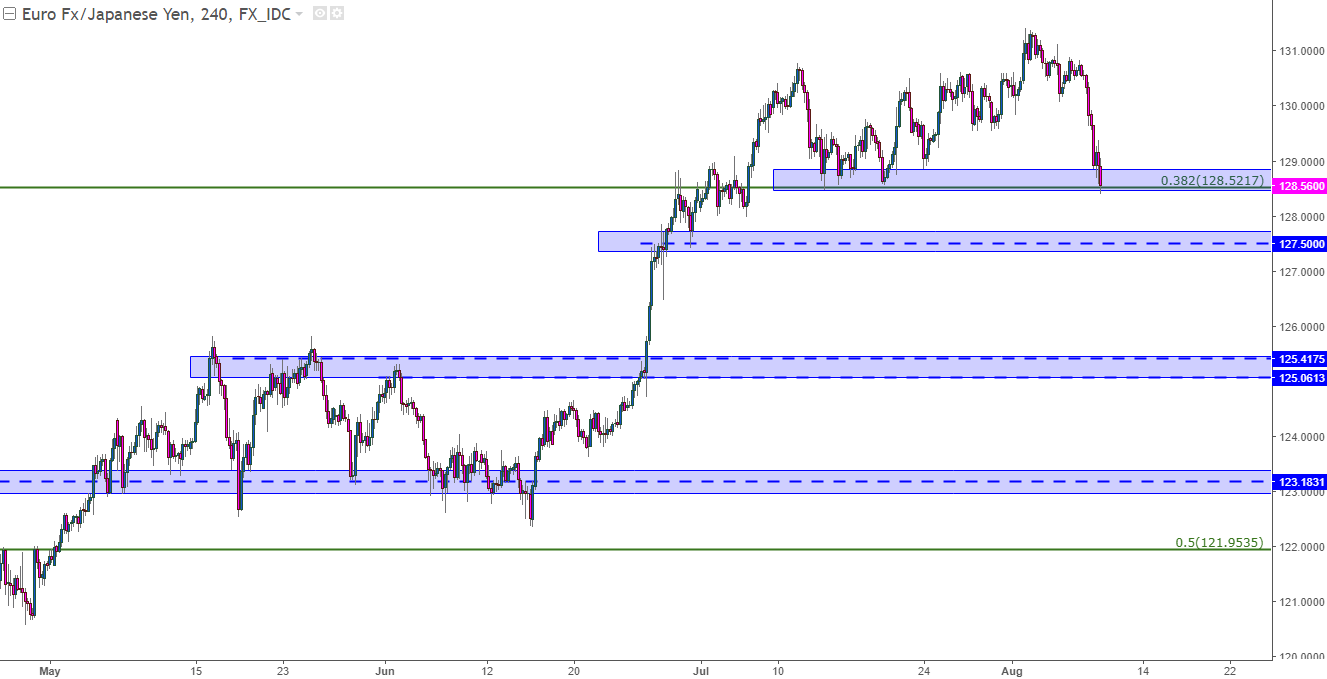
Chart prepared by James Stanley
GBP/JPY
While the Euro has been ripping under the expectation for a more-hawkish stance from the ECB, the continued dovishness from the Bank of England has continued to provide pressure to the British Pound. The most recent iteration of this dovishness came-in last Thursday, at the BoE’s most recent rate decision when the bank decreased growth forecasts going out to 2018. This removed a bit of pressure from the situation, as we had previously seen bidders taking GBP-higher after inflation began to print above expectations; but at last week’s BoE meeting, the bank seemed unnerved by this rising inflation; instead, show far more concern with the potential slowdown in the U.K. economy around Brexit negotiations.
In GBP/JPY, we have an ascending wedge formation that’s been building since the Federal Reserve rate hike in December. This is when the pair topped-out at 148.46; and after two failed attempts to take-out that high failed, in May and then July, sellers have begun to take-over.
GBP/JPY Daily: Ascending wedge formation – Trend-Line Support Testing
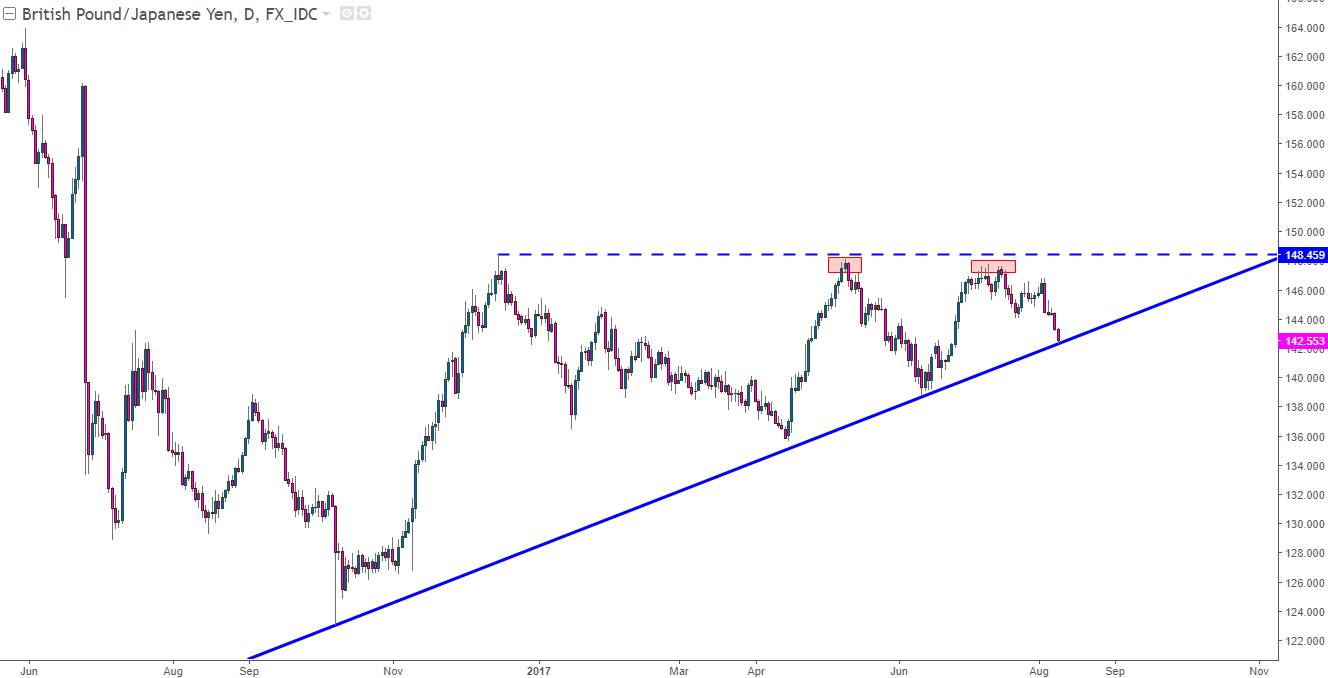
Chart prepared by James Stanley
Current prices are testing a key support level at 142.46. This is the 23.6% Fibonacci retracement from the bullish move that took place from October to December, 2016. The 38.2% level from this same Fibonacci retracement helped to set support in the pair in early-June, and the 50% retracement had helped to set support in early-April. Will buyers show-up at the 23.6% retracement to continue the pattern in August?
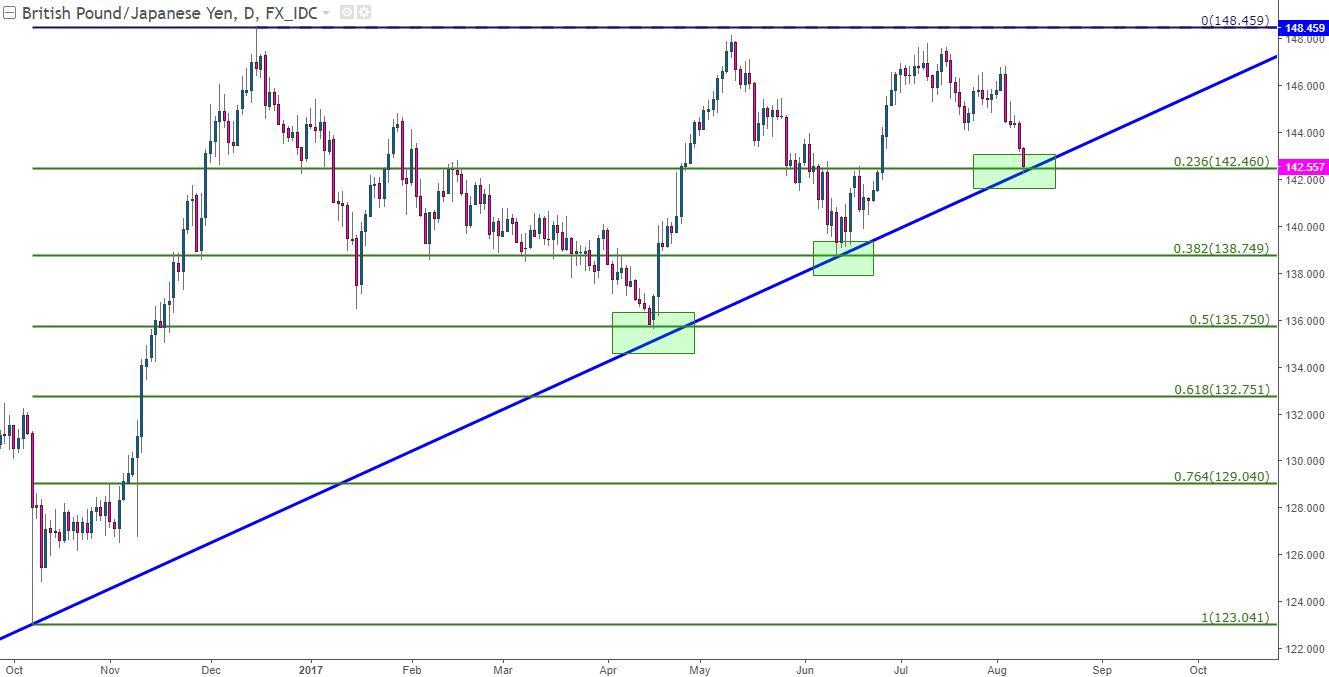
Chart prepared by James Stanley
For traders looking to trade a continuation of risk aversion, GBP/JPY could be a fairly attractive candidate. JPY will likely see strength under that scenario, and a weakened British Pound could contribute to the down-side move after the BoE inserted another push of dovishness into the equation last week.
For traders looking at such a thesis, they’d likely want to let this support level first break before looking to take-on bearish exposure. For those that wanted to be a bit more patient with the risk-aversion stance, allowing this support to break, and then waiting for this level to show-up as resistance could allow for such an approach.
GBP/JPY Four-Hour with Potential Support and Resistance Applied
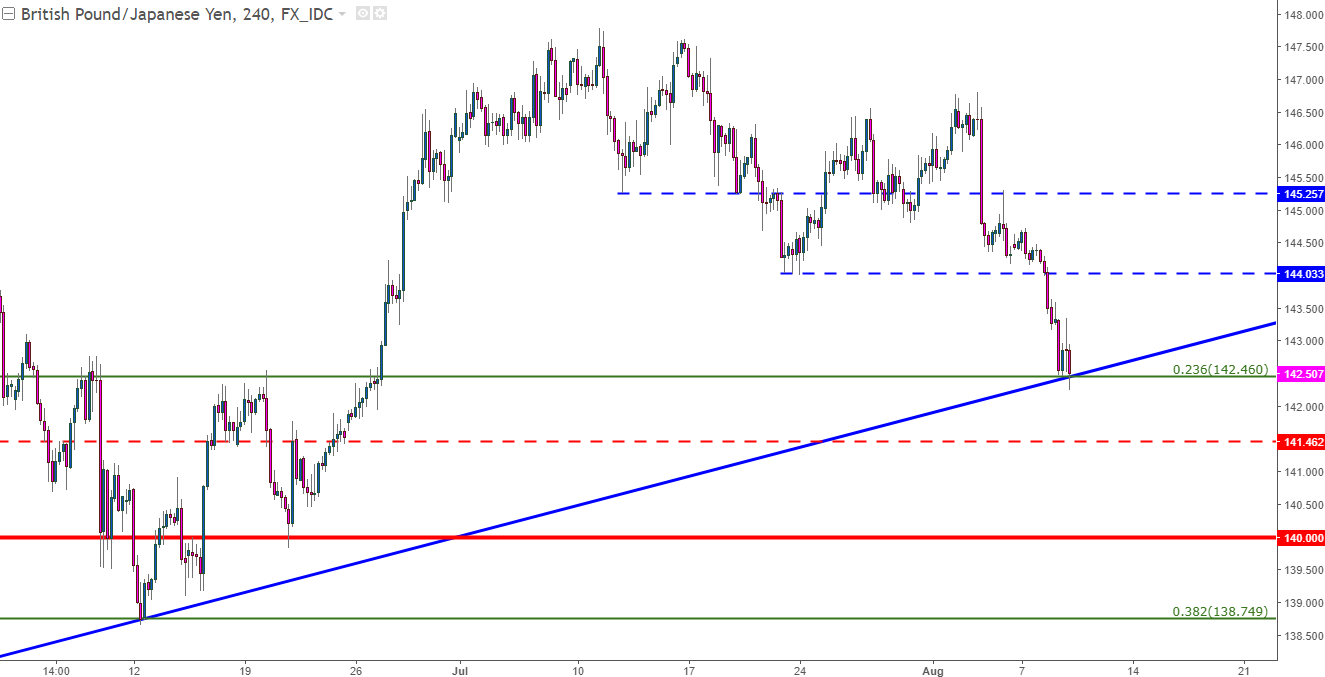
Chart prepared by James Stanley
--- Written by James Stanley, Strategist for DailyFX.com
To receive James Stanley’s analysis directly via email, please SIGN UP HERE
Contact and follow James on Twitter: @JStanleyFX


