EUR/USD, Euro, USD Talking Points:
- EUR/USD is continuing to fall from resistance after last week’s breakout was cut short.
- While longer-term EUR/USD bearish strategies may have potential, there’s a major spot of support sitting underneath price action that cauterized the lows in late-November, and this remains as sticking point for near-term strategies.
- The analysis contained in article relies on price action and chart formations. To learn more about price action or chart patterns, check out our DailyFX Education section.


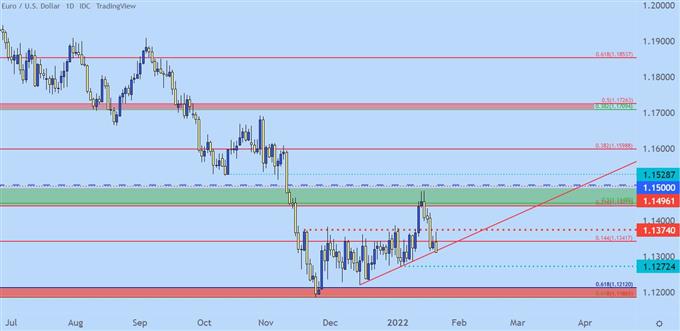
EUR/USD put in a breakout last week. It was a rather fast move, but it had been brewing for a bit as prices had the time to coil into an ascending triangle formation. Such setups will often be approached with the aim of bullish breakouts and that’s precisely what hit last week, right on the heels of another strong CPI print out of the United States.
That breakout in EUR/USD saw prices jump into the next zone of resistance, plotted from the Fibonacci level at 1.1448 up to the psychological level of 1.1500. As that breakout happened, the US Dollar quickly moved into oversold territory, which helped both USD to set support as EUR/USD began drop from that key spot of resistance.
A week later and this theme is still developing. Traders are keeping a watchful eye on the FOMC rate decision on the economic calendar for next Wednesday, attempting to get clues for just how hawkish the Fed might be for the remainder of this year. But, this morning’s European CPI print didn’t cause for much alarm and since then sellers have started to re-appear in EUR/USD.
Prices in the pair are now testing the support trendline that had helped to make the ascending triangle formation, just ahead of last week’s breakout.
EUR/USD Daily Price Chart

Chart prepared by James Stanley; EURUSD on Tradingview
EUR/USD Bigger Picture
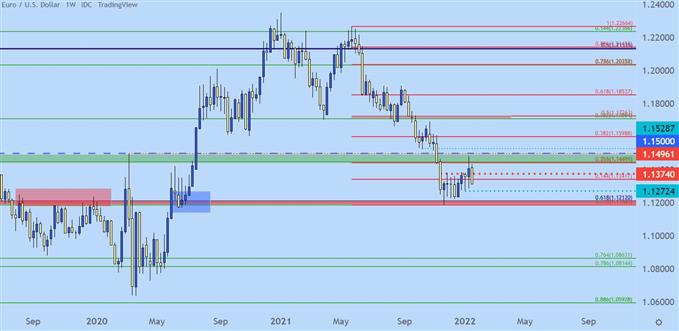
Taking a step back to the weekly chart and EUR/USD retains a bearish appeal, with perhaps even more interest on the short-side should this week see prices close as a bearish engulfing candlestick. That setup is showing as of this writing but there’s still a day to go and that can be negated.
The big point of interference is the same support that came into the picture in late-November, quelling the six-month sell-off in the pair. This zone runs between Fibonacci levels at 1.1187 and 1.1212; the latter of which is the 61.8% retracement of the ‘lifetime move’ in EUR/USD. This is also a level that’s had a pull on price action in the pair for the past seven years, in various forms.
The big question is whether bears have the ammunition to test through that key level and, in-turn, this relates to USD breakout potential; as it’d be difficult for the USD to pose a sustained move without at least some participation from the Euro.
A level or zone of this nature with long-term importance can often take a couple of attempts before it’s traded through. Or, alternatively, if there’s a major fundamental factor driving the flow, which, in our current scenario, would likely need a very hawkish FOMC shocking markets, which doesn’t seem likely at this point given how stretched expectations have already become.
EUR/USD Weekly Price Chart

Chart prepared by James Stanley; EURUSD on Tradingview
EUR/USD Levels
While it appears that the short-term trend is beginning to align with the longer-term theme, traders should remain cautious here, especially considering that big spot of longer-term support lurking underneath current price action.
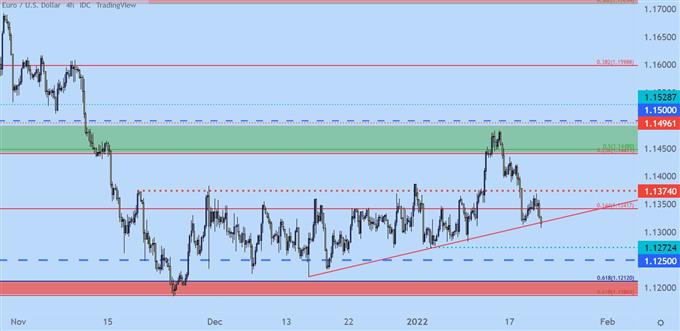
As looked at in yesterday’s USD Price Action Setups, EUR/USD remained attractive on the short side for either a resistance hit towards that 1.1374 level or, alternatively a breach of the 1272 spot.
Price action came within five pips of that resistance before turning; and now the next possible avenue is a break of the 1272 support, which can keep the door open for a push down to the longer-term support zone of 1187-1212. A short-term breakout of that nature can look to the 1250 psychological level as a first stop of support potential after the 1272 break, after which the focus can then cast back down to the ‘big’ zone.
EUR/USD Four-Hour Price Chart

Chart prepared by James Stanley; EURUSD on Tradingview
--- Written by James Stanley, Senior Strategist for DailyFX.com
Contact and follow James on Twitter: @JStanleyFX


