


Euro Technical Analysis, EUR/USD, EUR/JPY, EUR/GBP, EUR/NZD – Talking Points:
- EUR/USD could extend gains after breaching Falling Wedge resistance.
- EUR/JPY at risk of a reversal as prices carve out Double Top pattern.
- EUR/GBP challenging trend-defining 55-EMA.
- EUR/NZD eyeing a more extended rebound higher after hurdling key resistance.

The under-fire Euro has sprung back to life in recent days and rebounded robustly against its major counterparts. While this dynamic looks set to continue against the higher-beta New Zealand Dollar, other funding currencies may regain lost ground in the coming days. Key levels to watch for EUR/USD, EUR/JPY, EUR/GBP, EUR/NZD.
EUR/USD Daily Chart – Falling Wedge Break May Inspire Larger Rebound
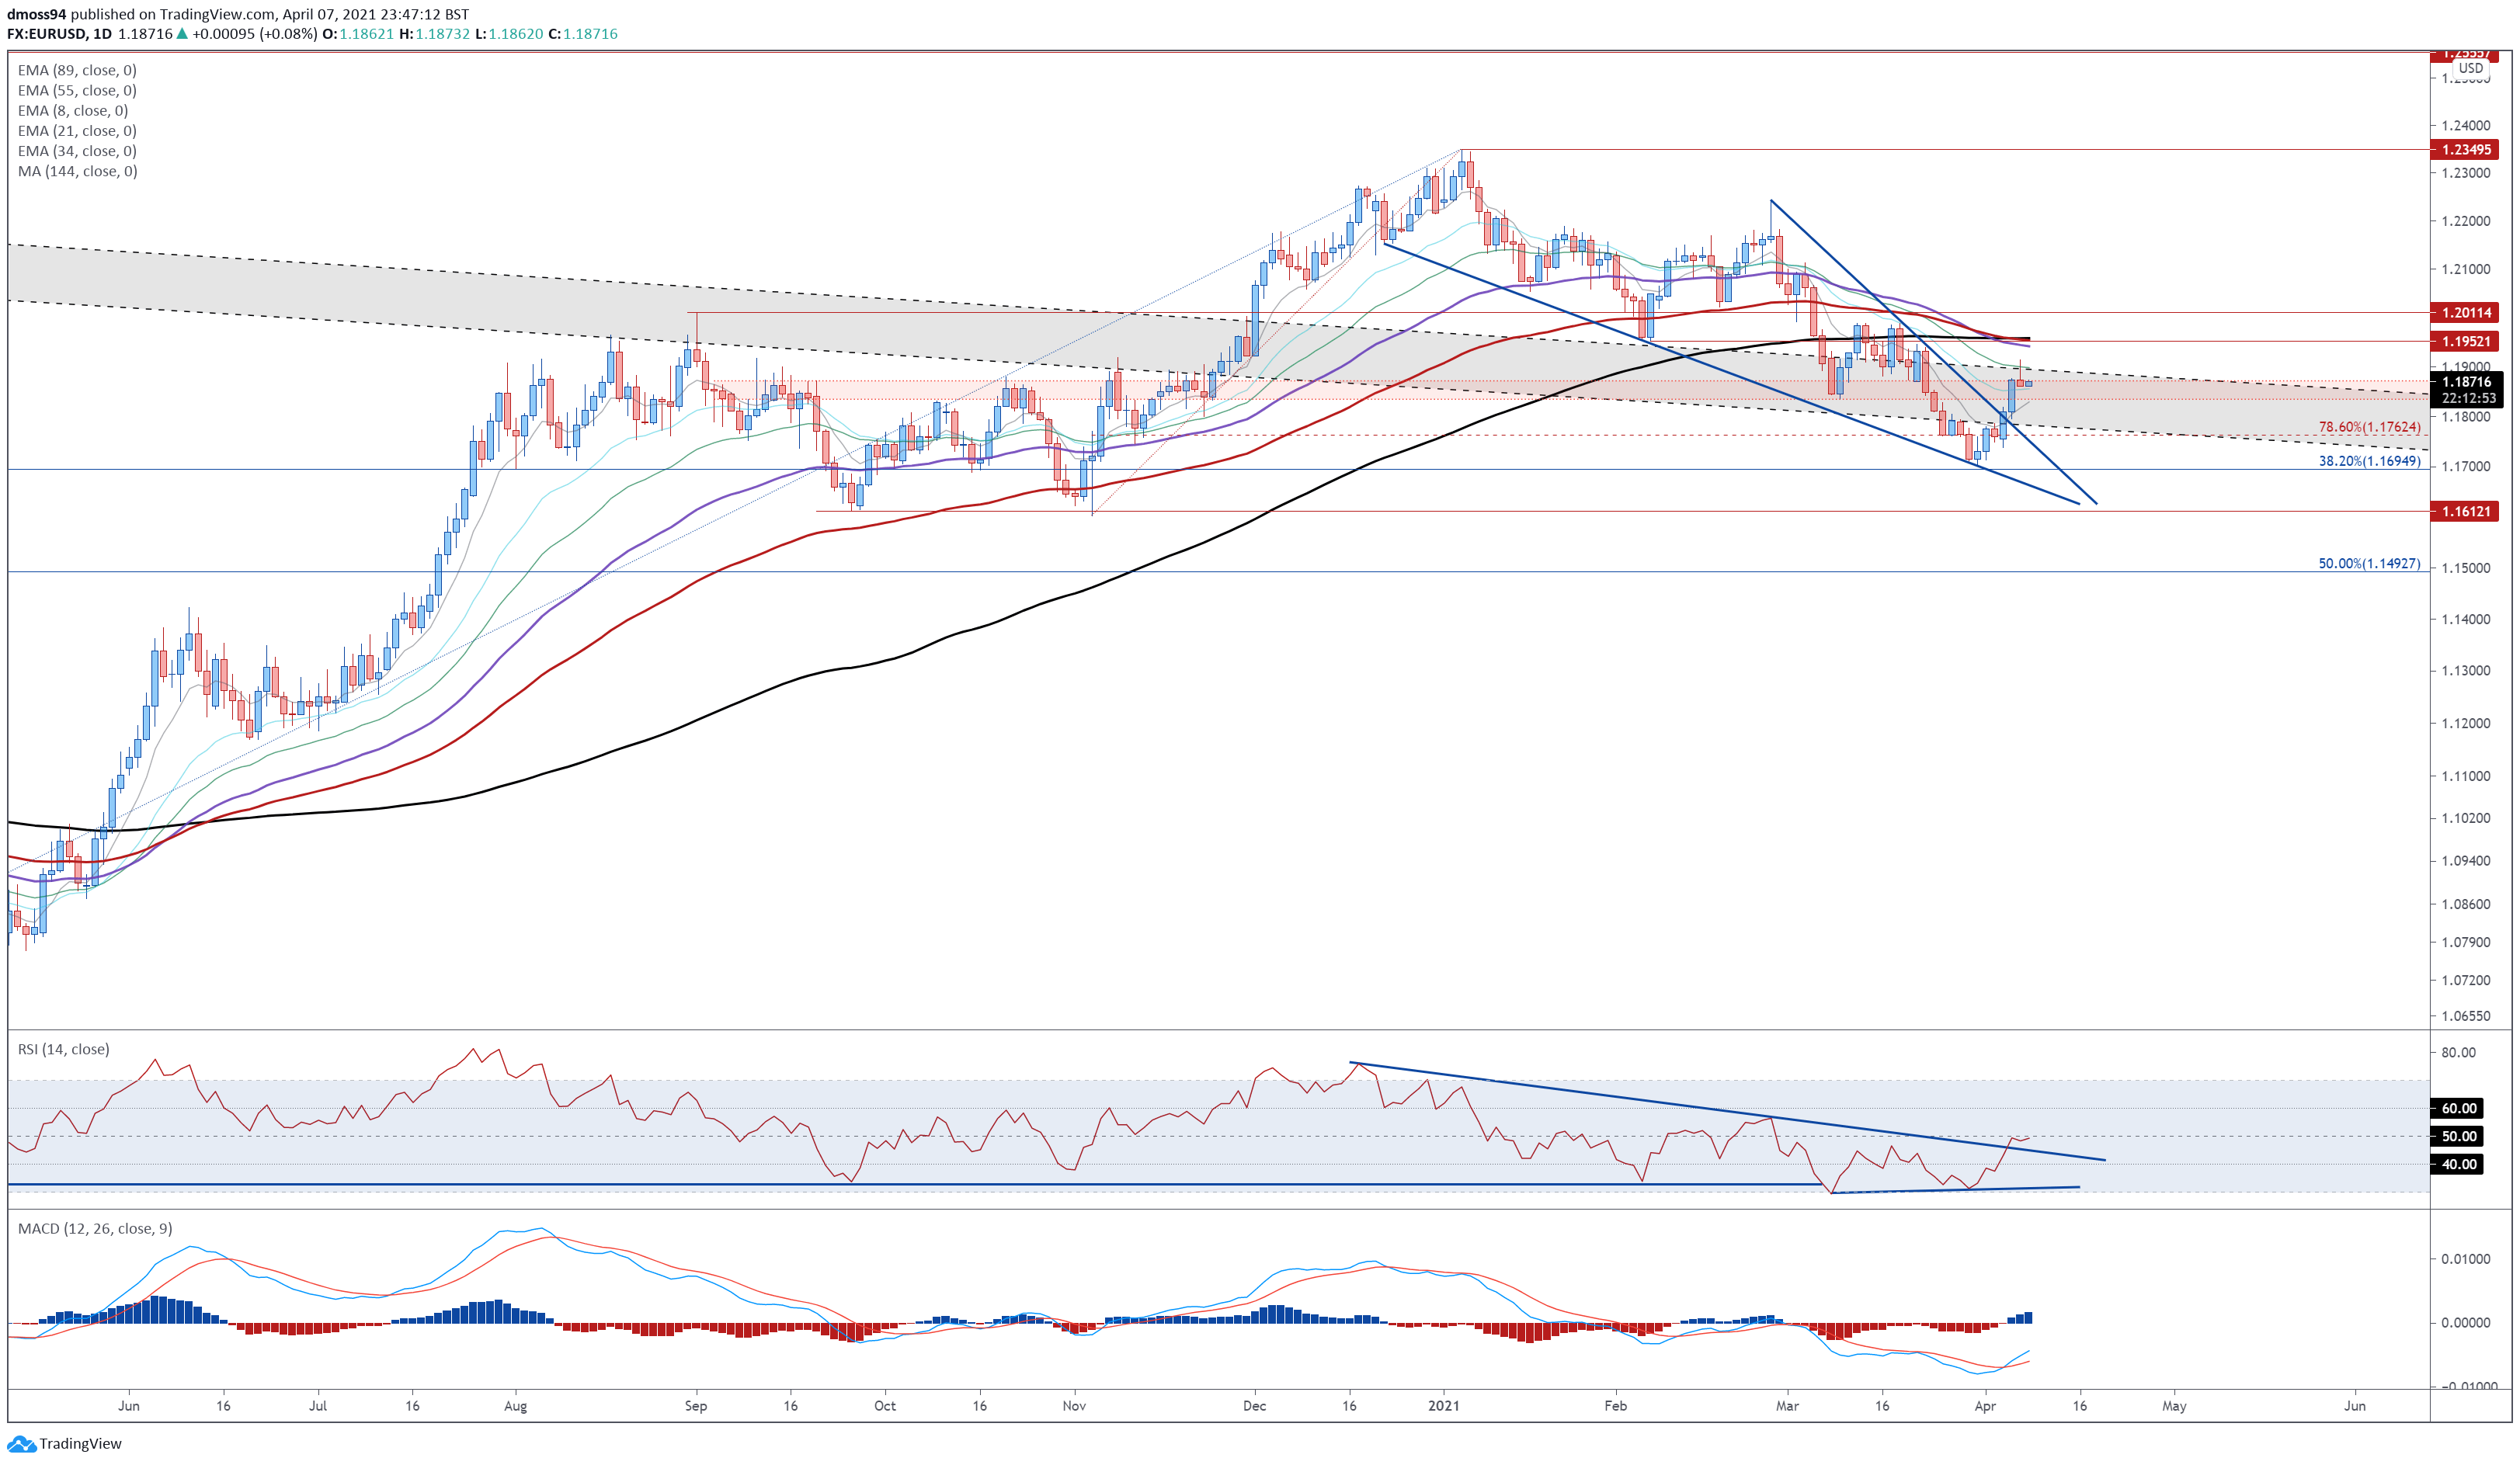
Chart prepared by Daniel Moss, created with Tradingview
EUR/USD rates have rebounded robustly in recent days after sliding to the lowest levels since early November of 2020, as prices surge back above the 1.1800 handle and the 21-EMA (1.1857).
With the exchange rate breaking out of a bullish Falling Wedge reversal pattern, a bullish crossover taking place on the MACD indicator, and the RSI snapping its downtrend extending from the December extremes, the path of least resistance seems higher in the near term.
A daily close above the psychologically imposing 1.1900 handle would probably intensify buying pressure and bring the sentiment-defining 144-EMA (1.1959) into the fray. Hurdling that is required to carve a path to challenge the February high (1.2243).
However, if 1.1900 remains intact, a pullback to the 78.6% Fibonacci (1.1762) is hardly out of the question.
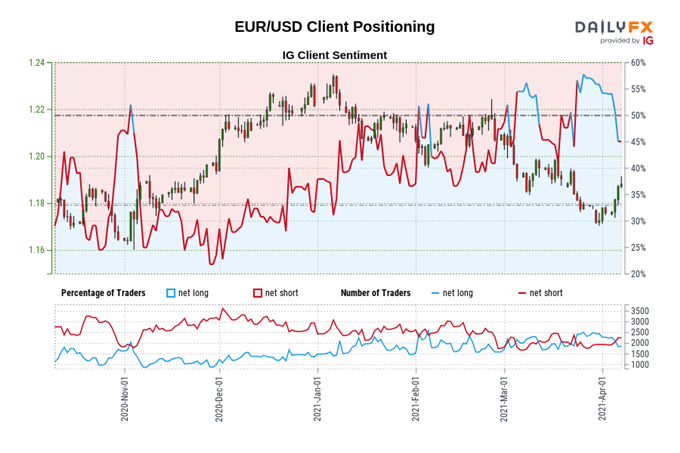
The IG Client Sentiment Report shows 43.59% of traders are net-long with the ratio of traders short to long at 1.29 to 1. The number of traders net-long is 14.39% lower than yesterday and 26.57% lower from last week, while the number of traders net-short is 9.73% higher than yesterday and 25.74% higher from last week.
We typically take a contrarian view to crowd sentiment, and the fact traders are net-short suggests EUR/USD prices may continue to rise.
Traders are further net-short than yesterday and last week, and the combination of current sentiment and recent changes gives us a stronger EUR/USD-bullish contrarian trading bias.
EUR/JPY Daily Chart – Double Top in Play?
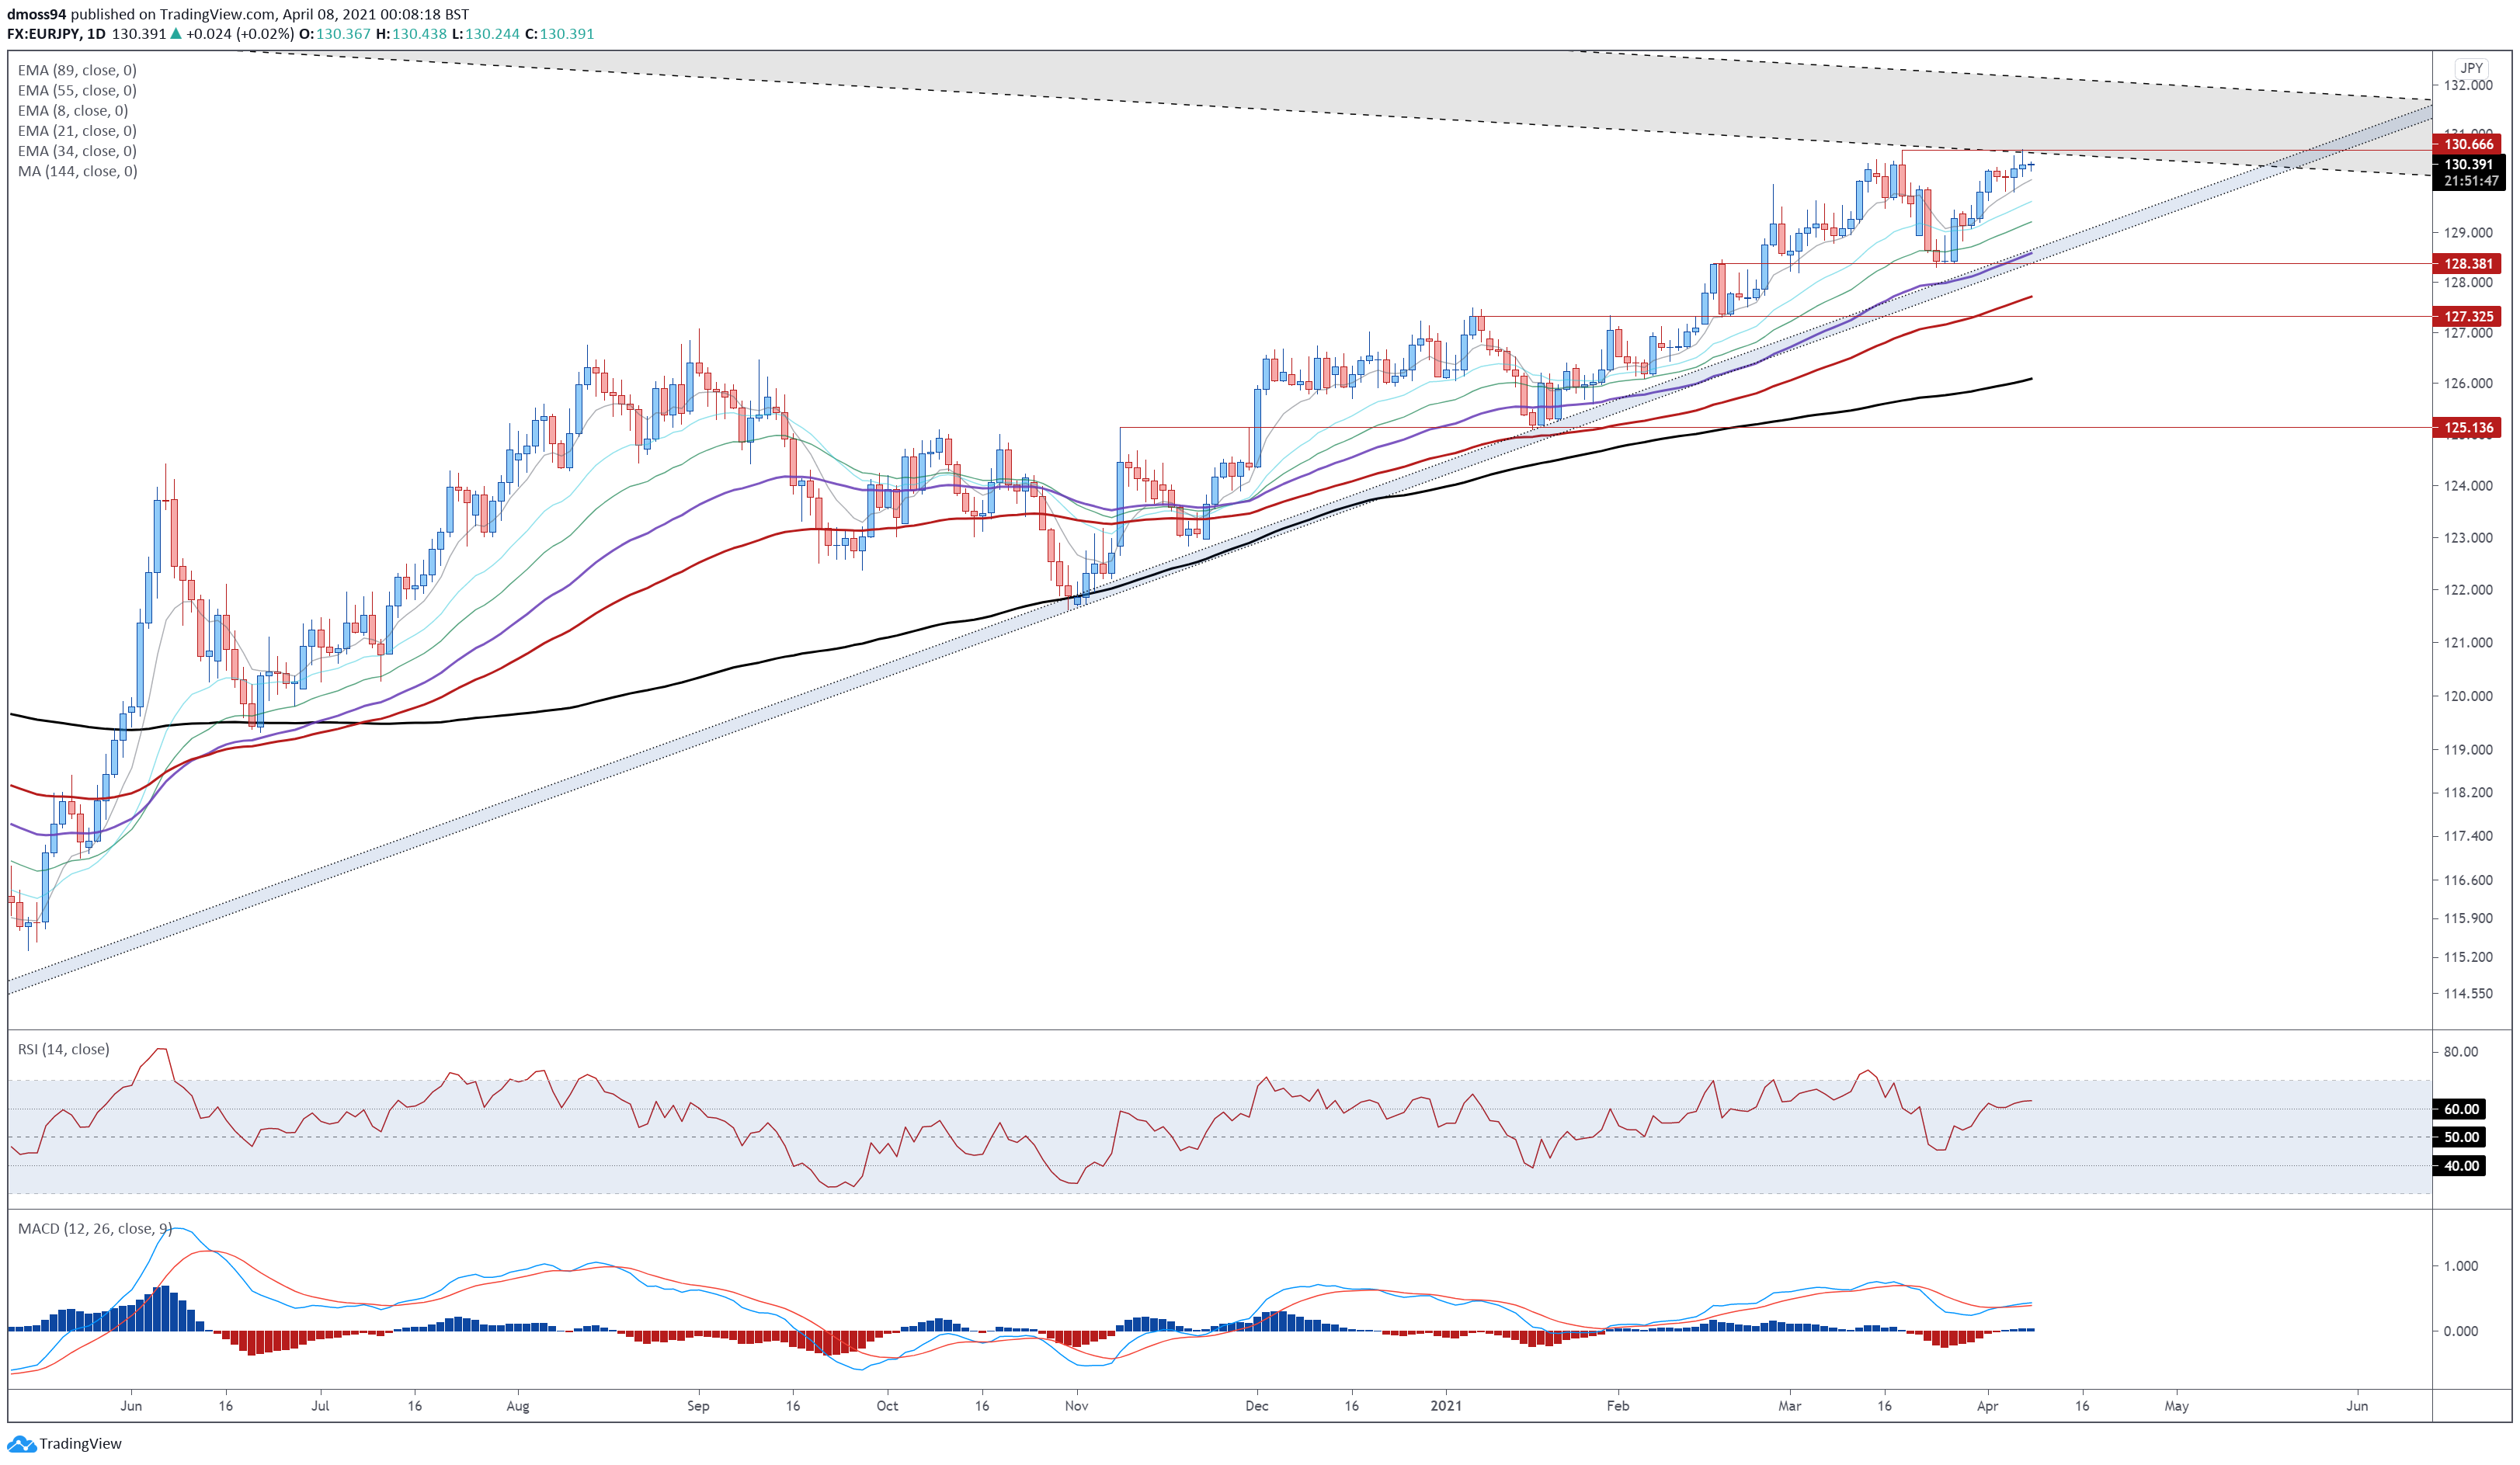
Chart prepared by Daniel Moss, created with Tradingview
The Euro has strengthened significantly against the haven-associated Japanese Yen, climbing just under 2% higher since dipping back to the trend-defining 55-EMA on March 26. The exchange rate is now attempting to breach the yearly high (130.67) set on March 18 and may be at risk of a short-term reversal lower, as prices carve out a bearish Double Top pattern.
Bearish RSI and MACD divergence also hints at uptrend exhaustion and may inspire would-be sellers, if prices is unable to gain a firm foothold above the March 18 high. Sliding back below the 8-EMA (130.08) likely propels price towards confluent support at the Double Top neckline (128.38) and uptrend extending from the May 2020 nadir.
On the other hand, a daily close above 130.70 could signal the resumption of the primary uptrend and bring the July 2018 high (131.99) into the crosshairs.
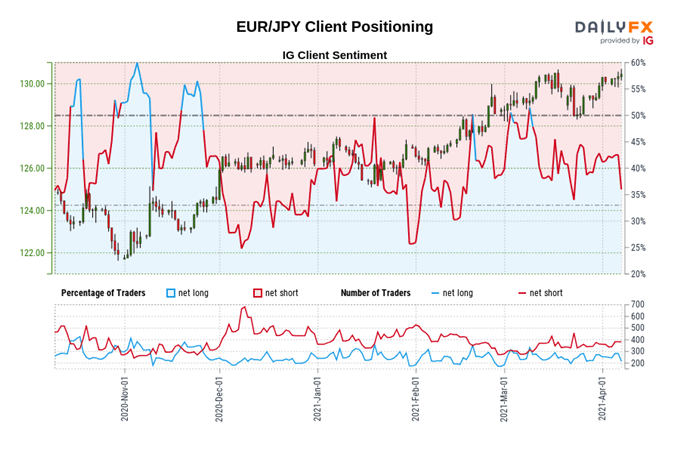
The IG Client Sentiment Report shows 35.20% of traders are net-long with the ratio of traders short to long at 1.84 to 1. The number of traders net-long is 4.13% lower than yesterday and 7.20% lower from last week, while the number of traders net-short is 18.61% higher than yesterday and 4.15% higher from last week.
We typically take a contrarian view to crowd sentiment, and the fact traders are net-short suggests EUR/JPY prices may continue to rise.
Traders are further net-short than yesterday and last week, and the combination of current sentiment and recent changes gives us a stronger EUR/JPY-bullish contrarian trading bias.
EUR/GBP Daily Chart – 55-EMA Capping Upside Potential
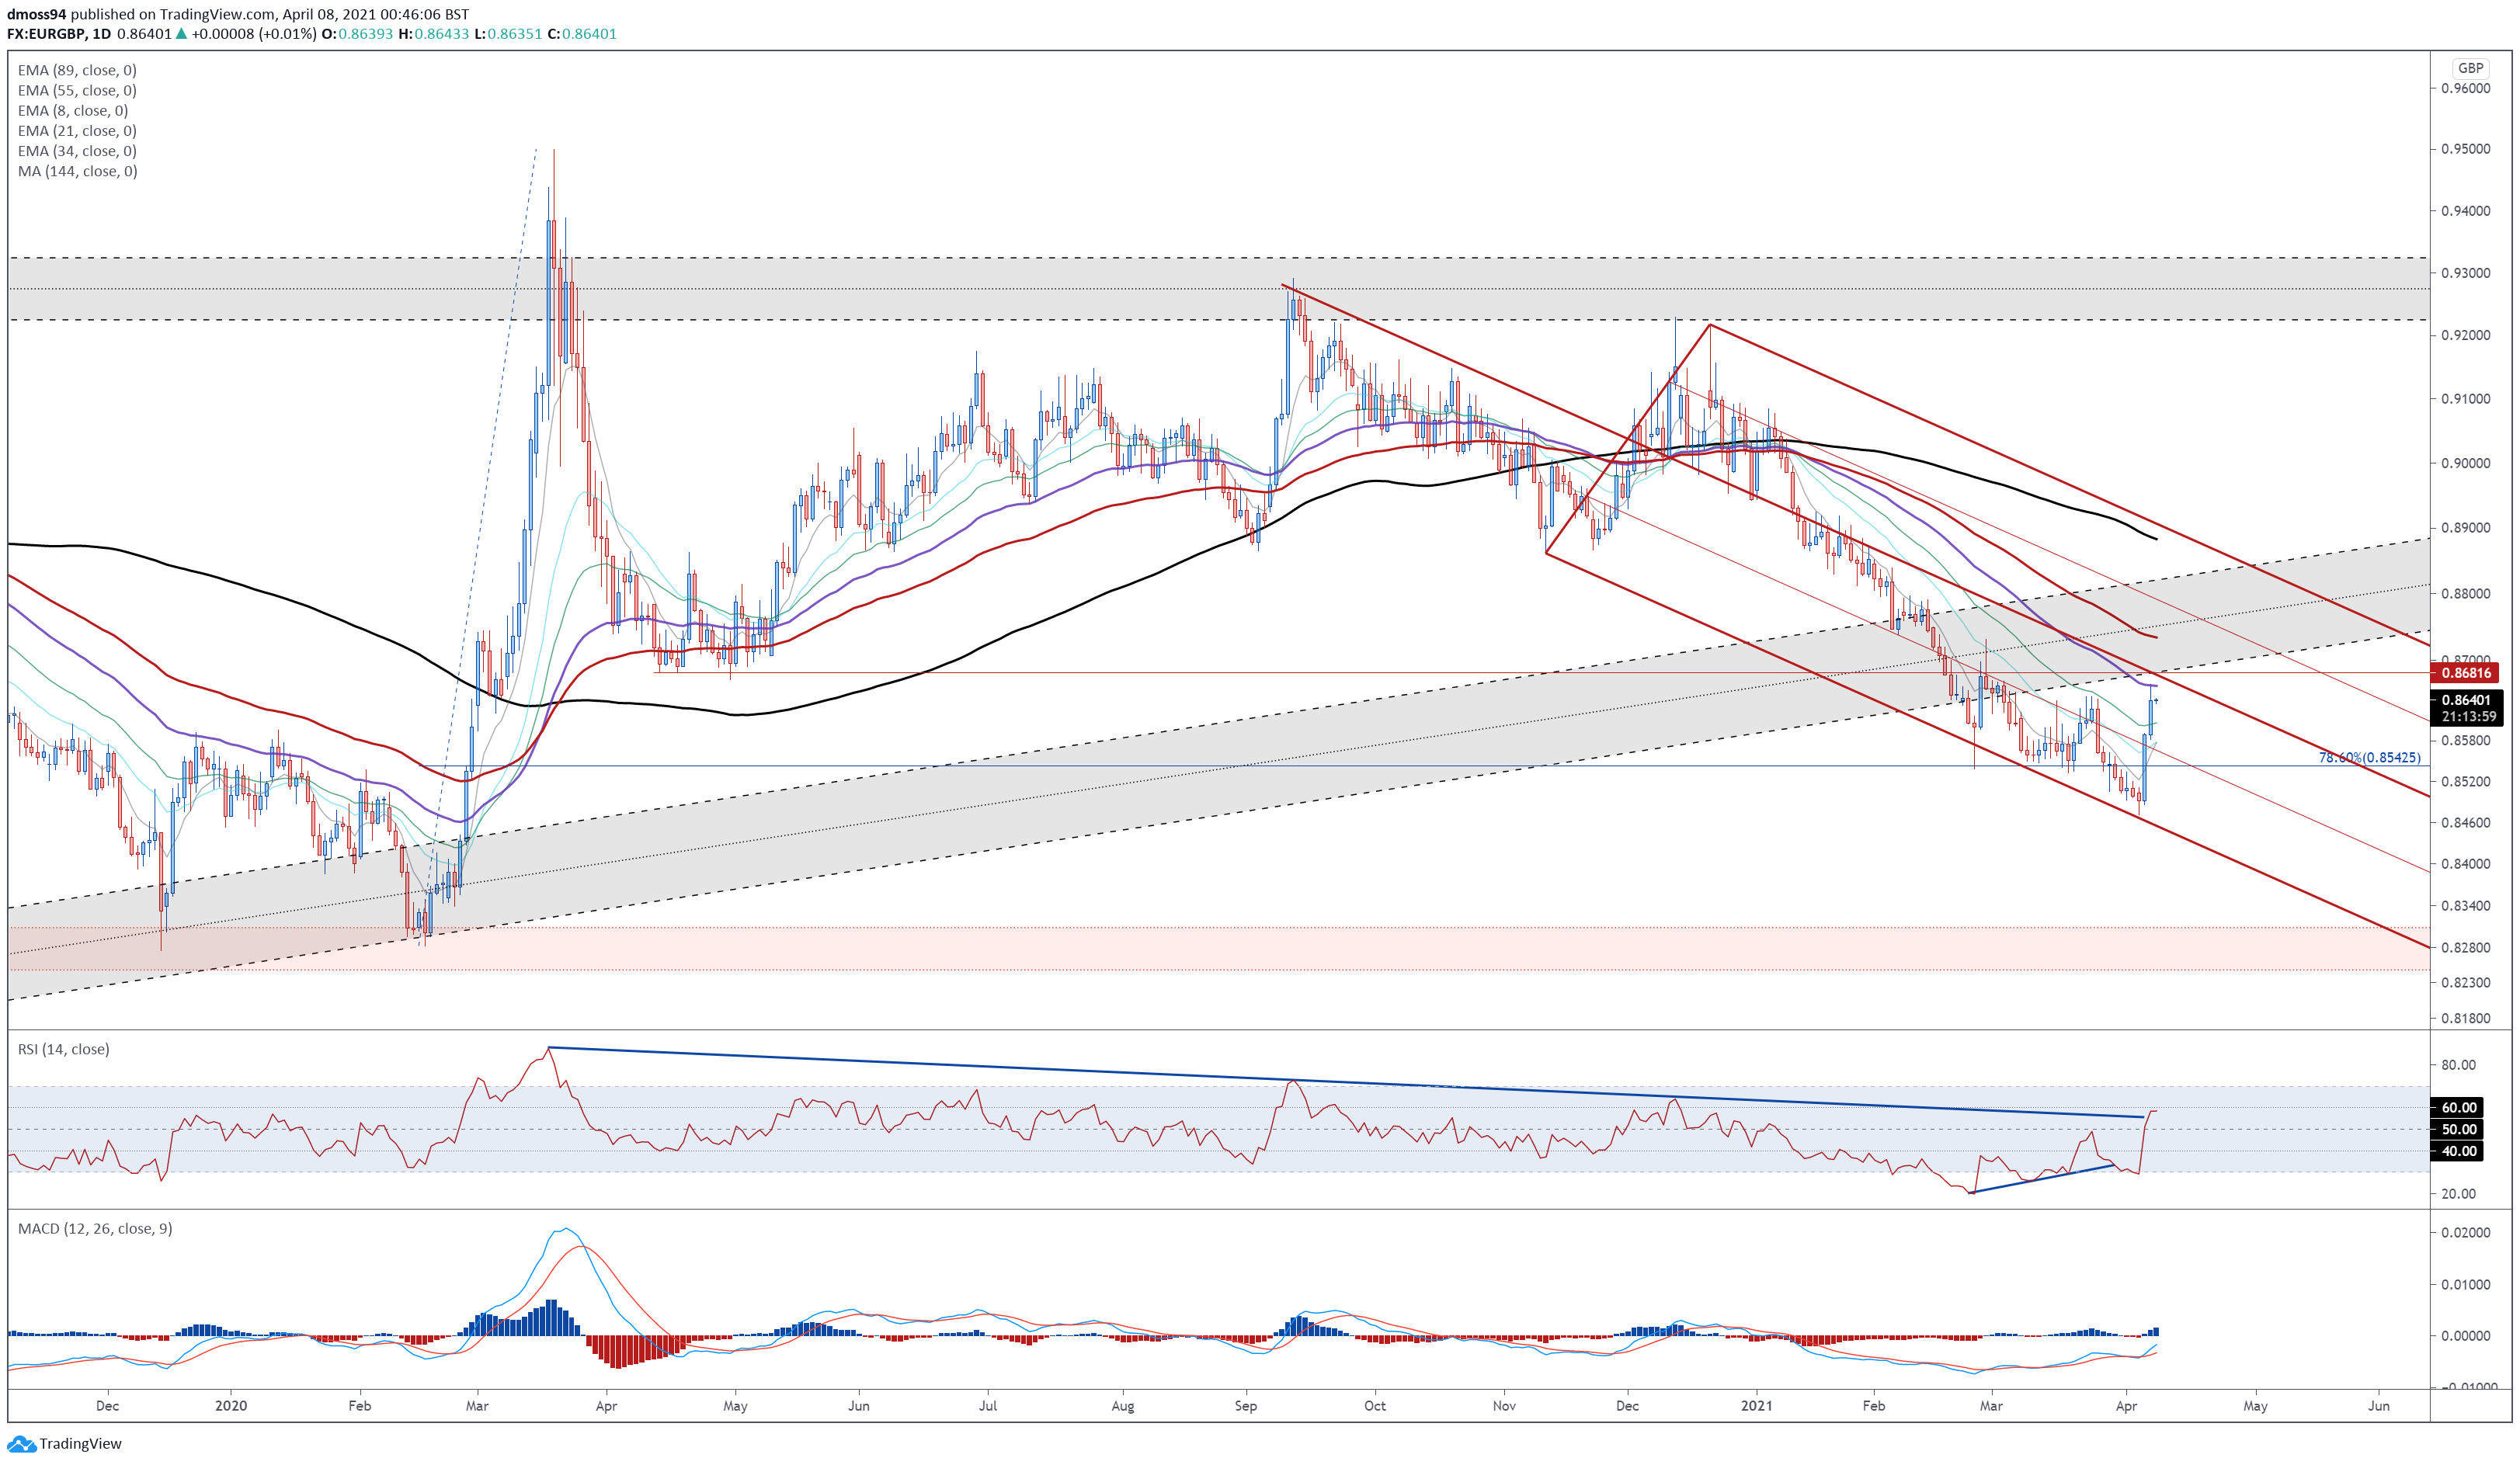
Chart prepared by Daniel Moss, created with Tradingview
The EUR/GBP exchange rate has stormed higher in the last two days, surging 2.26% from the lowest levels since February 2020.
However, with price continuing to track within the confines of a descending Andrews’ Pitchfork, and the 55-EMA (0.8662) appearing to cap upside potential, this recent climb may prove to be nothing more than a temporary counter-trend correction.
Indeed, if the 55-EMA successfully neutralizes buying pressure, a reversal back towards the yearly low (0.8472) looks more than likely. That being said, a convincing break above the pitchfork median line and 0.8700 mark could result in a more extended rebound to challenge the 89-EMA (0.8734).
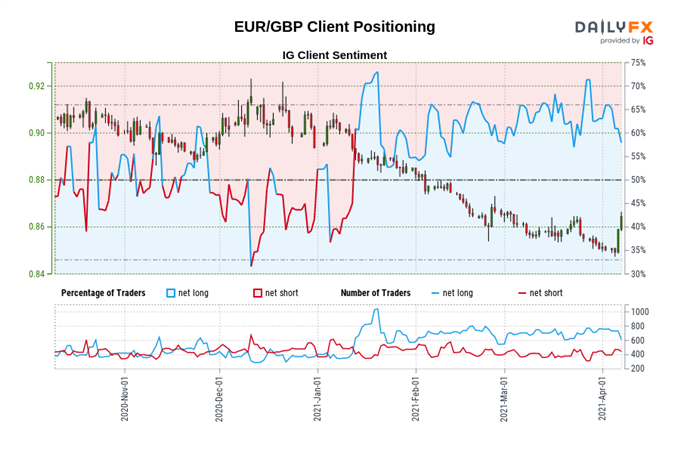
The IG Client Sentiment Report shows 55.52% of traders are net-long with the ratio of traders long to short at 1.25 to 1. The number of traders net-long is 11.40% lower than yesterday and 24.48% lower from last week, while the number of traders net-short is 8.86% higher than yesterday and 8.60% higher from last week.
We typically take a contrarian view to crowd sentiment, and the fact traders are net-long suggests EUR/GBP prices may continue to fall.
Yet traders are less net-long than yesterday and compared with last week. Recent changes in sentiment warn that the current EUR/GBP price trend may soon reverse higher despite the fact traders remain net-long.
EUR/NZD Daily Chart – 144-EMA in the Crosshairs
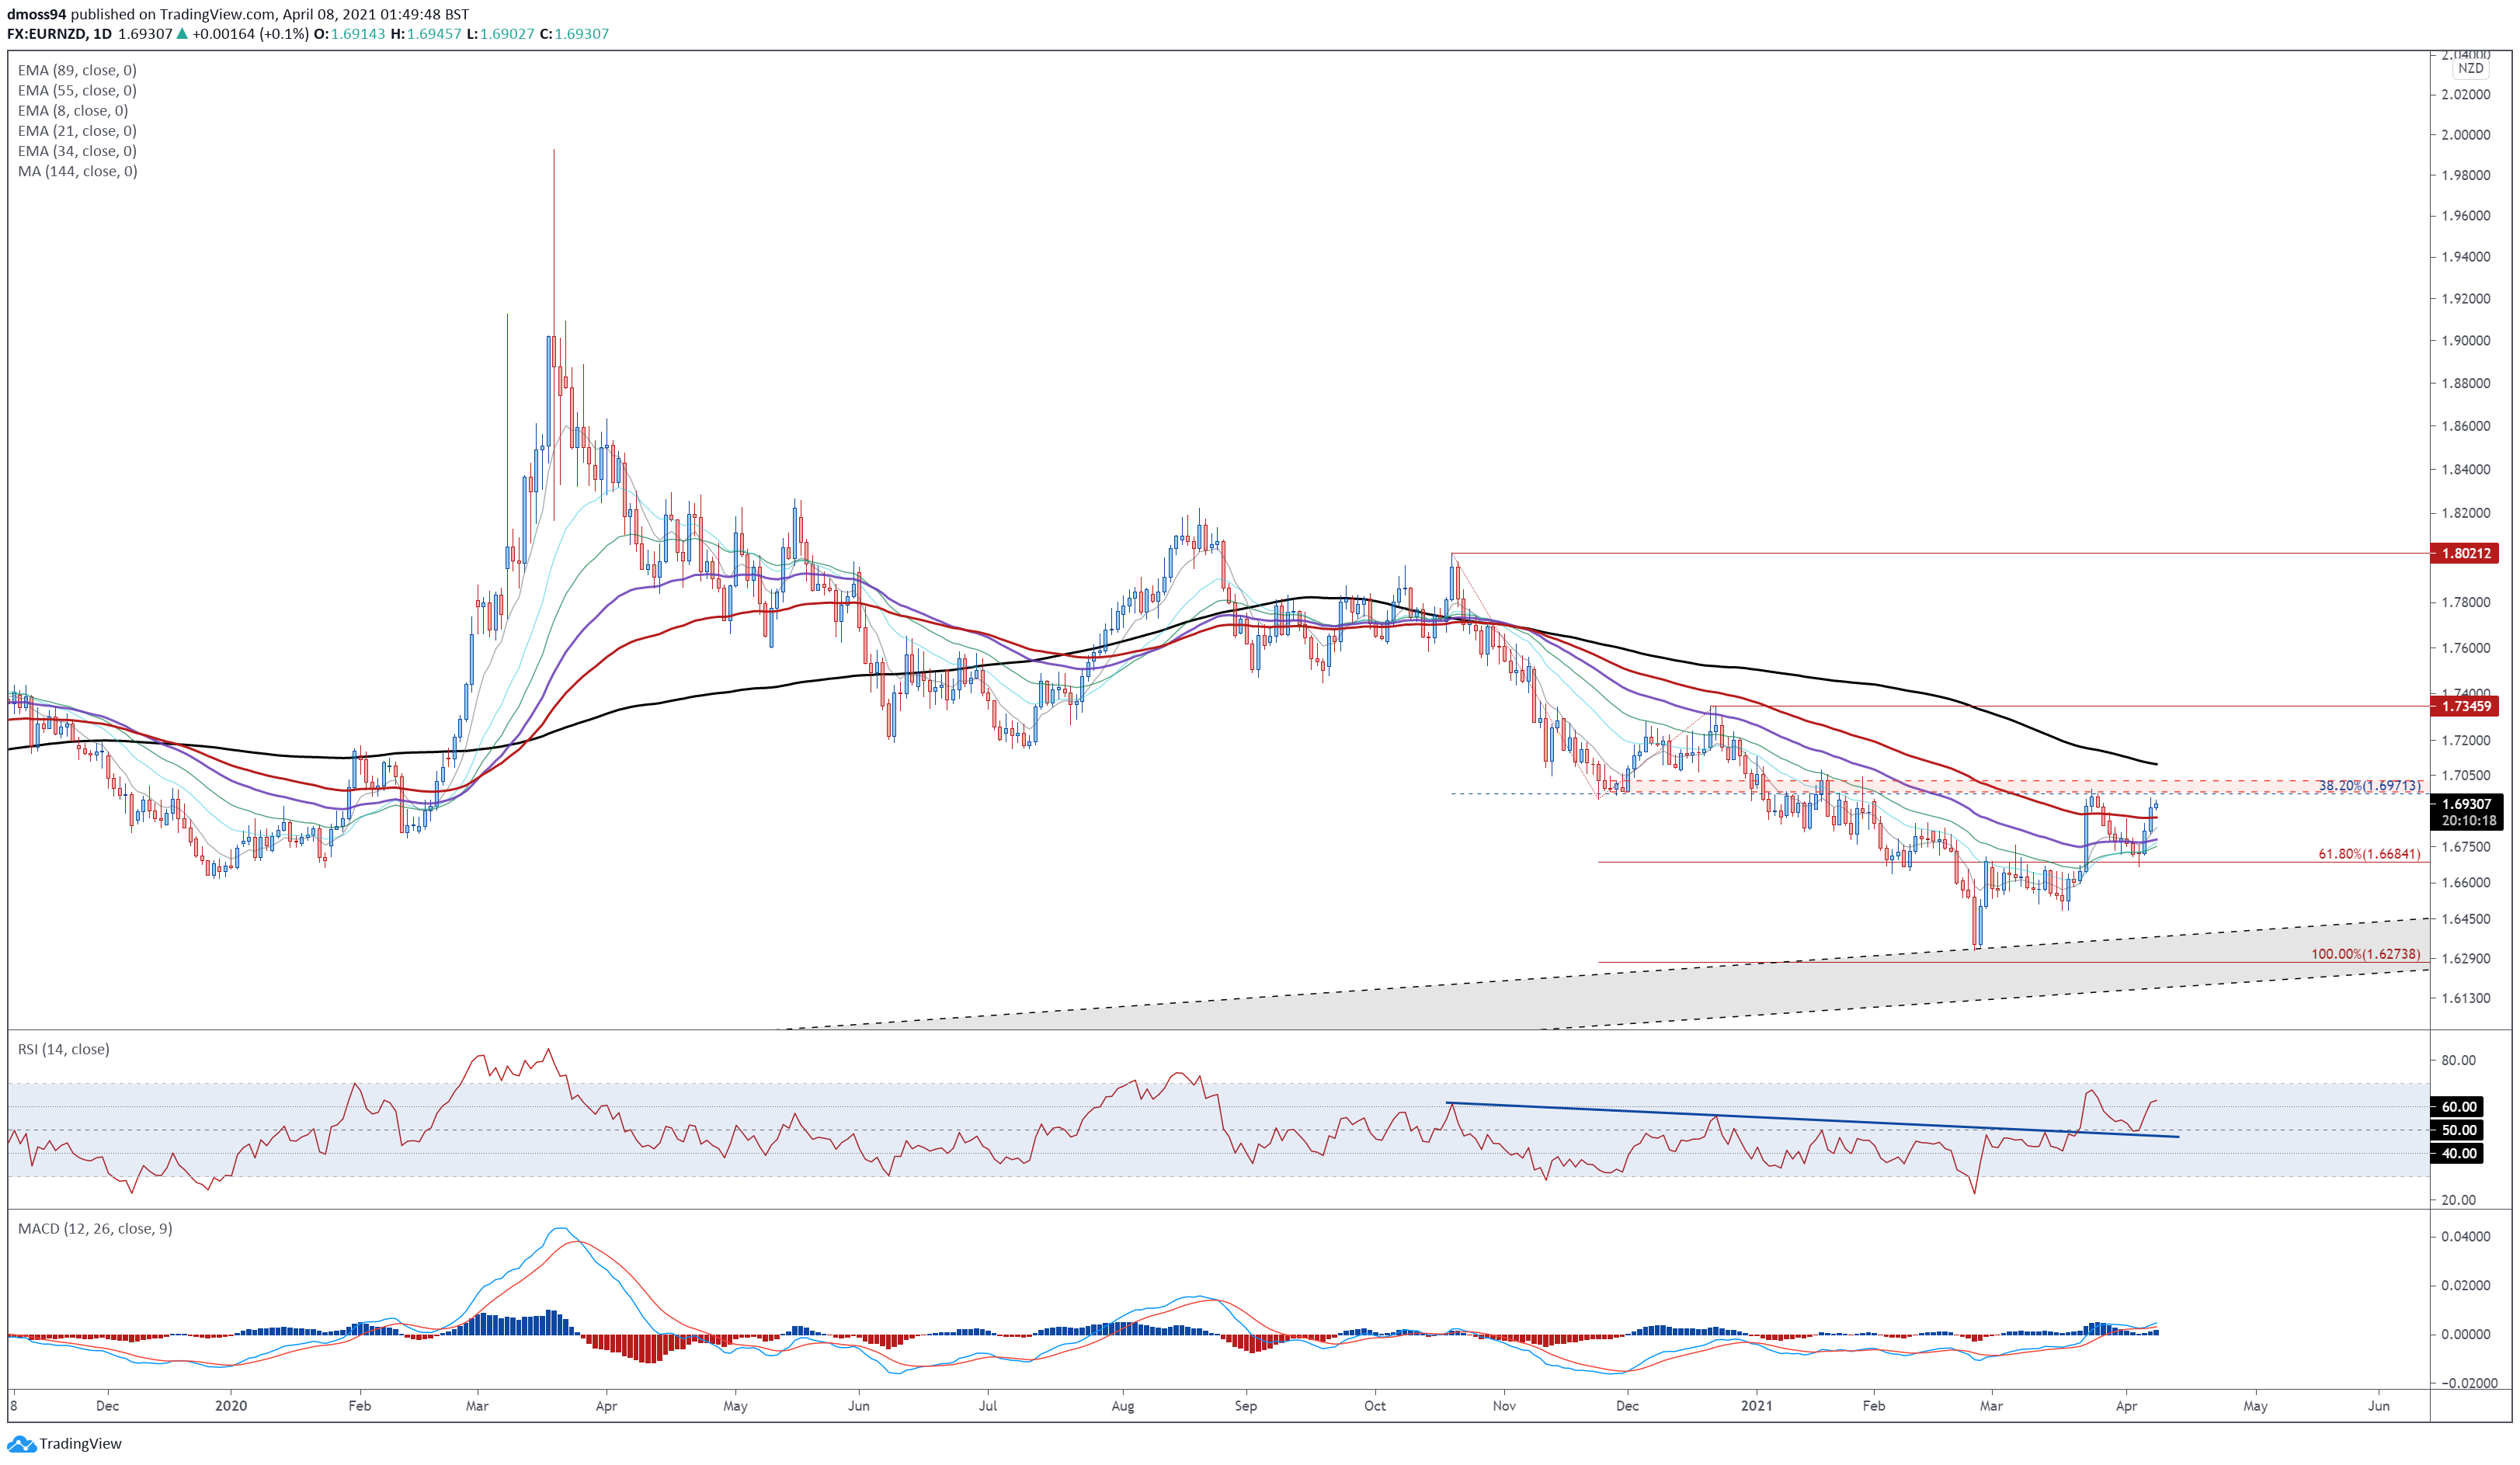
Chart prepared by Daniel Moss, created with Tradingview
EUR/NZD rates look poised to extend recent gains, as prices probe a key resistance range at 1.6980 – 1.7020 after bursting back above the 89-EMA (1.6873).
With the RSI hovering above 60, and the MACD crossing into bullish territory for the first time since October last year, the path of least resistance seems skewed to the topside.
A daily close above 1.7030 is required to validate bullish potential and carve a path for buyers to challenge the December high (1.7346). However, if range resistance holds firm, a short-term pullback to the trend-defining 55-EMA (1.7314) could be in the offing.
-- Written by Daniel Moss, Analyst for DailyFX
Follow me on Twitter @DanielGMoss


