


EUR/GBP and EUR/CAD Technical Analysis
See Our latest trading guides for free and discover what is likely to move the markets through Q4 of this year.
Euro price action against British Pound & Canadian Dollar
Last week Euro softened further against British pound. On Friday, EURGBP closed the weekly candlestick with nearly 1.3% loss. Meanwhile, the European currency recovered slightly against Canadian Dollar and closed the weekly session with a 0.6% gain.
This week, the Relative Strength Index (RSI) abandoned the oversold territory on EUR/GBP highlighting some weakness in the current downtrend. On the other hand, the oscillator crossed below 50 on EUR/CAD indicating to buyer’s lack of momentum to keep pushing the price higher.
Having trouble with your trading strategy? Need a hand? Here’s the #1 Mistake That Traders Make
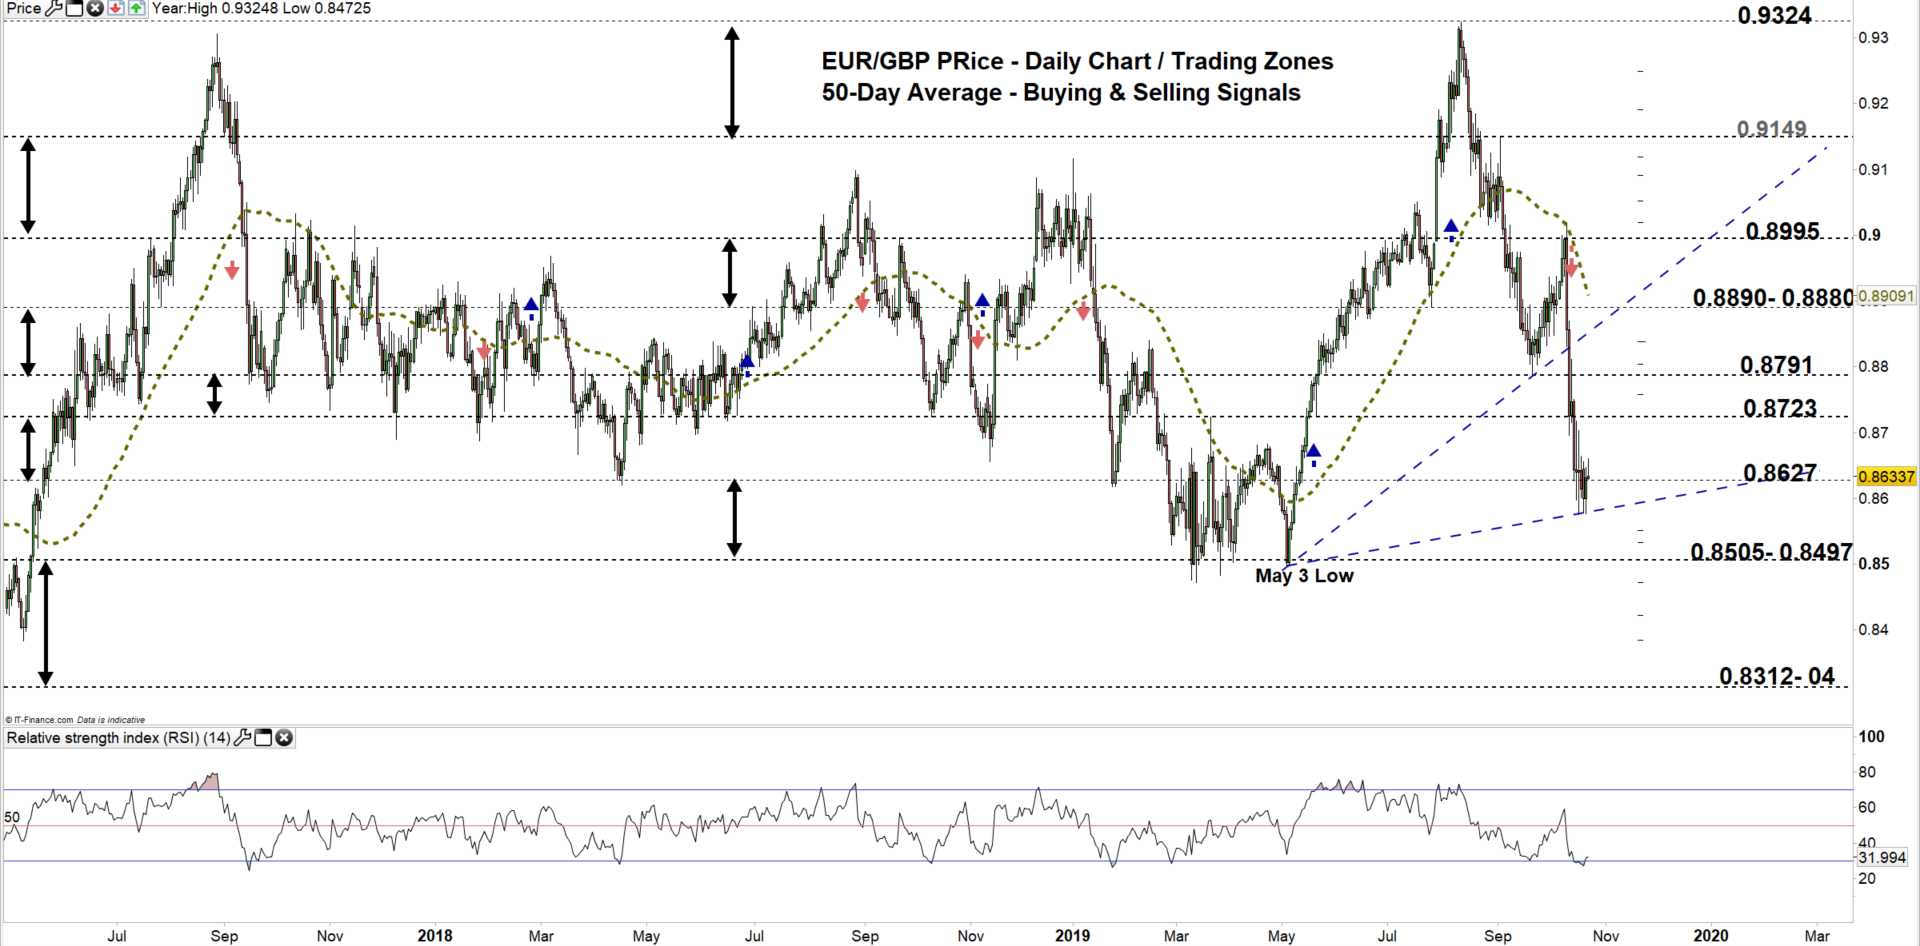
EUR/GBP Daily PRice CHART (June 3 , 2017 – OCt 23, 2019) Zoomed Out
EUR/GBP Daily Price CHART (May 1 – Oct 23, 2019) Zoomed in
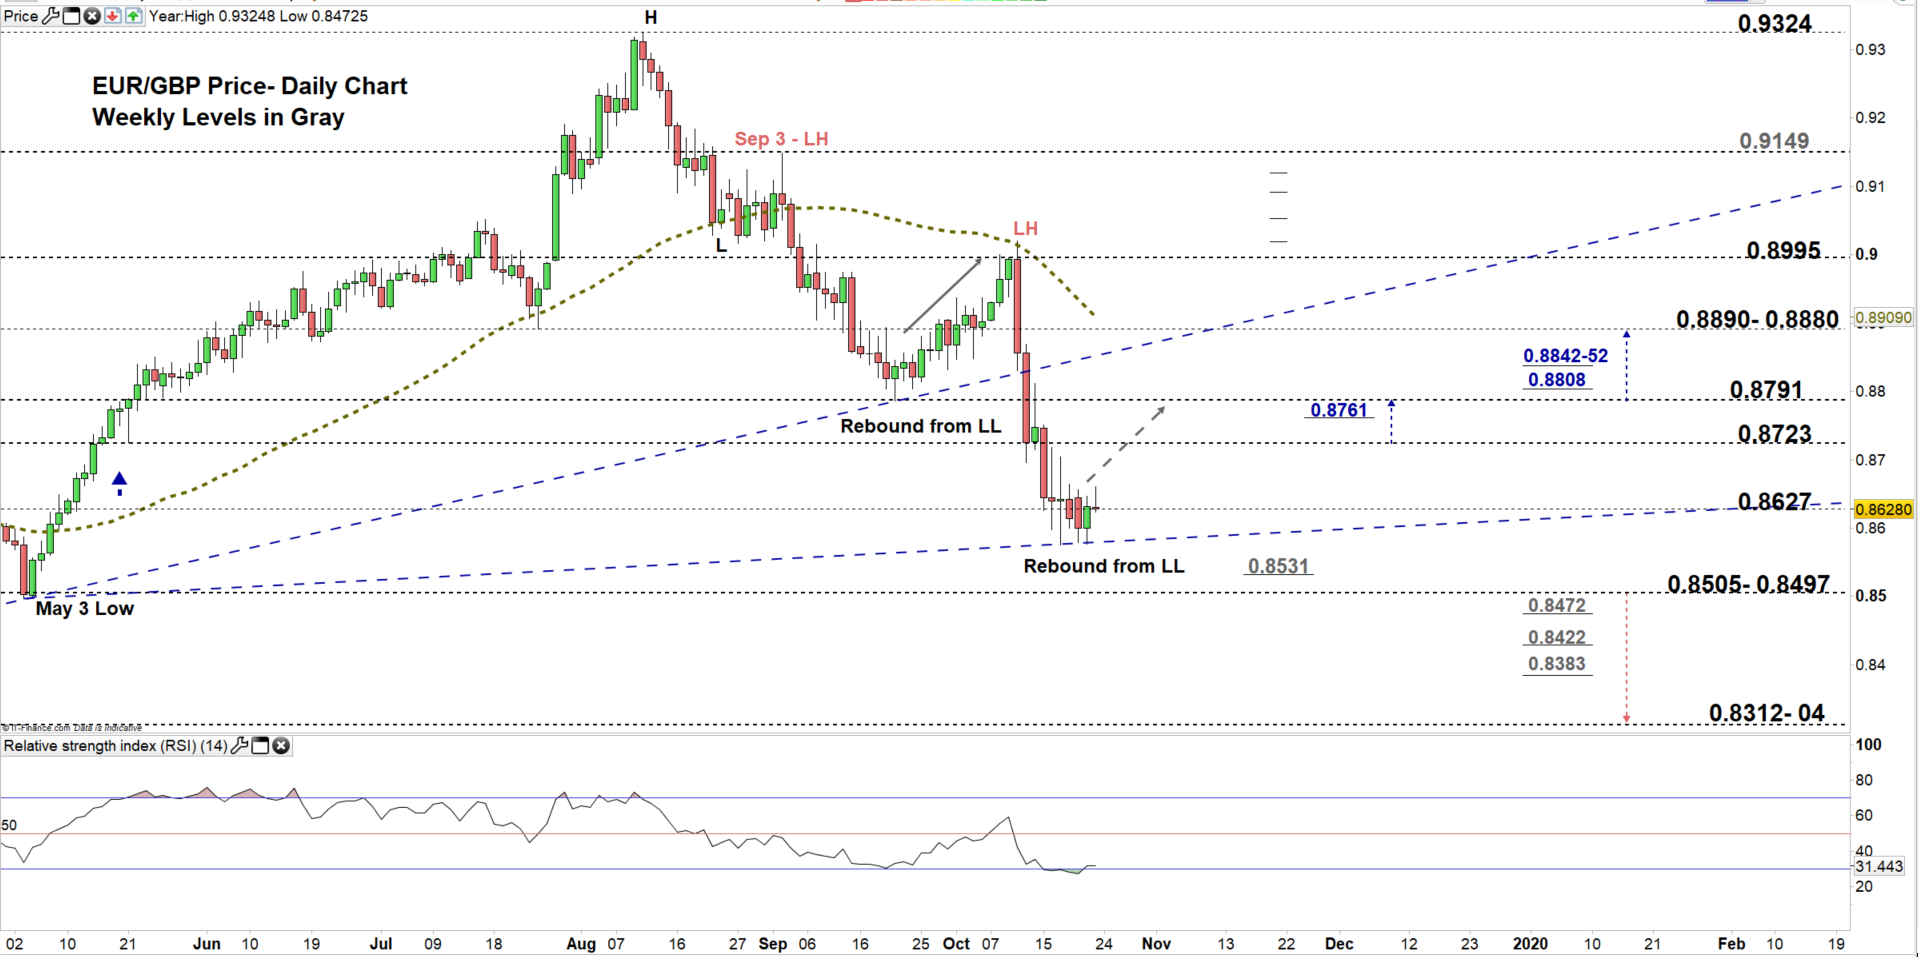
Looking at the daily chart, we notice On Sep 3 EUR/GBP corrected lower creating a lower high at 0.9149. On Sep 13 the price started a downtrend move creating lower highs with lower lows led the pair to its lowest level in over five months.
Downtrend move paused since Oct 18. Currently, the price tests moving in a higher trading zone 0.8627- 0.8723. Thus, a close above the low end of the zone could send the pair towards the high end. Further close above the high end could see EURGBP trading even higher towards 0.8791. However, the daily resistance level underlined in the chart (zoomed in) should be watched closely.
On the flip side, a close below the low end could pave the way to resume bearish price action below the Oct 17 low at 0.8575. Further close below 0.8497 could see EURGBP trading towards the vicinity of 0.8312-04. Having said that, the weekly support levels marked on the chart should be kept in focus.
Just getting started? See our Beginners’ Guide for FX traders
EUR/CAD Daily PRice CHART (April 15, 2017– OCt 23, 2019) Zoomed Out

EUR/CAD Daily PRice CHART (July 23 – Oct 23, 2019) Zoomed In

From the daily chart, we notice on Monday EUR/CAD broke below the 50-day average then declined to a lower trading zone 1.4476- 1.4644 generating two bearish signals.
Hence, the price may be on its way for a test of the low end of the zone. Further close below this level could see EURCAD trading even lower towards the vicinity of 1.4389-79. Although, the daily and weekly levels underlined on the chart (zoomed in) should be considered.
That said, a close above the high end of the zone could open the door to test daily and weekly resistance level. However, another close above 1.4736 may be required to resume bullish price action towards 1.4818. Nevertheless, the weekly levels underscored on the chart would be worth monitoring.
Written By: Mahmoud Alkudsi
Please feel free to contact me on Twitter: @Malkudsi


