


EUR/GBP Technical Analysis
- The near-term downtrend in EUR/GBP may be paused after a bullish candlestick formation
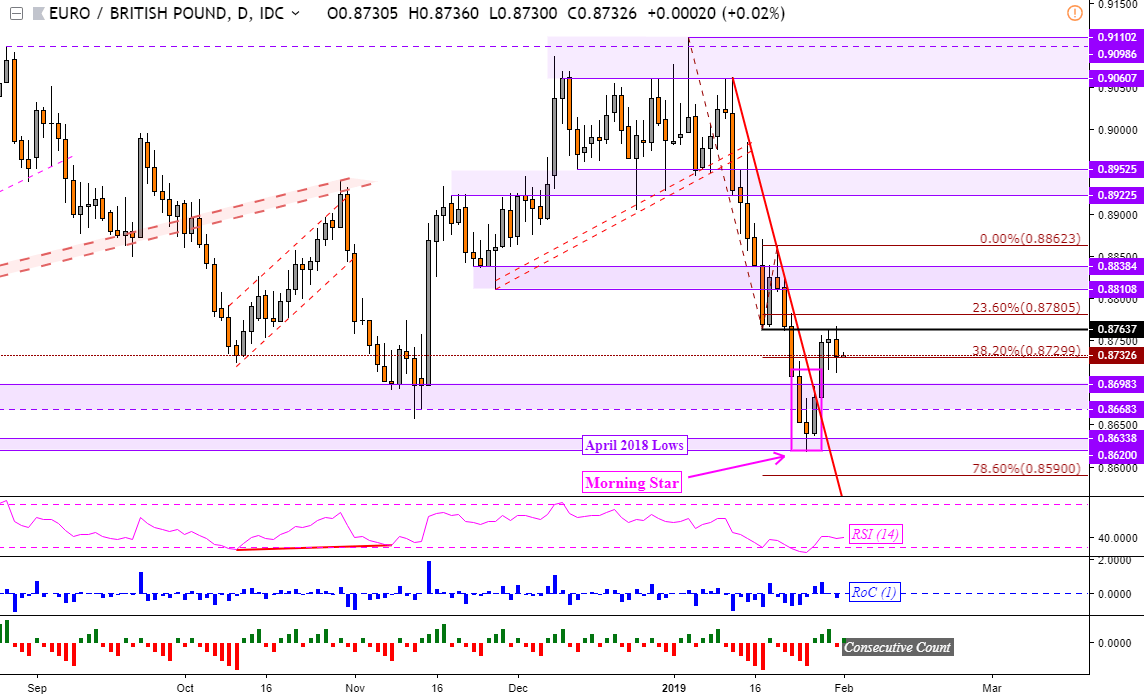
- Immediate resistance appears to be at 0.87637, closing above would open the door to gains
- Watch for a close under a rising support line on the 4-hour chart which may resume losses
Just started trading EUR/GBP? Check out our beginners’ FX markets guide !
Last time when I looked at EUR/GBP, it was on the verge of extending its downtrend which began earlier in January. The pair had to breach April 2018 lows (0.8620) and that would have opened the door to testing levels last seen in 2016/2017. But, this was not the case as support held and prices pushed higher instead.
What initiated the near-term recovery in the Euro technically was a Morning Star bullish reversal pattern that formed at the most recent bottom. I noted this as a warning on my twitter feed which you may follow @ddubrovskyFX for more timely updates.
Confirmation was then followed with a daily close above the near-term falling trend line from January 11th. As such, this leaves the British Pound vulnerable to more losses against its European counterpart. Especially if resistance is breached at 0.87637 on the daily chart below.
EUR/GBP Daily Chart
EUR/GBP 4-Hour Chart
Zooming in on the 4-hour chart, keep a close eye on a rising support line from late January. For signs that the dominant downtrend in January could reassert itself, I am closely watching for a daily close under this trend line.
From there, EUR/GBP would once again find itself facing 0.8620 for another chance at extending the downtrend. On the other hand, if the pair keeps climbing and fulfilling the Morning Star candlestick pattern, resistance seems to be the 23.6% Fibonacci extension at 0.87805 followed by 0.88108.

**Charts created in TradingView
FX Trading Resources
- Join a free Q&A webinar and have your trading questions answered
- Just getting started? See our beginners’ guide for FX traders
- See our free guide to learn what are the long-term forces Euro prices
- See how the British Pound and Euro are viewed by the trading community at the DailyFX Sentiment Page
--- Written by Daniel Dubrovsky, Junior Currency Analyst for DailyFX.com
To contact Daniel, use the comments section below or @ddubrovskyFX on Twitter


