EUR/GBP Technical Analysis
- EUR/GBP might be on the verge of extending its downtrend as April 2018 lows give way
- Falling through support opens the door to testing Fibonacci extension at 0.8590, 0.8434
- If support holds, near-term resistance is a horizontal range in-between 0.86683 – 0.86983
Just started trading EUR/GBP? Check out our beginners’ FX markets guide !
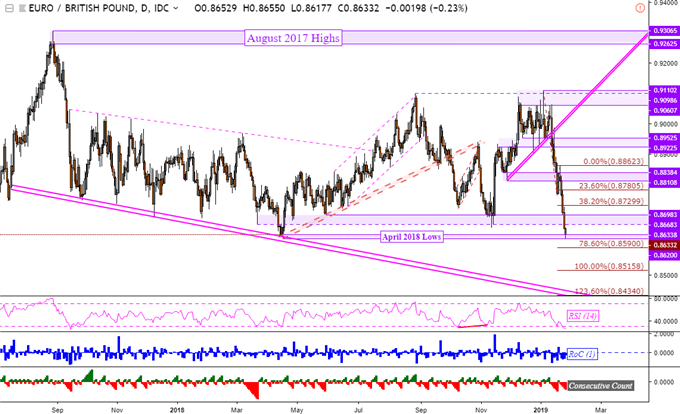
The Euro has lost about 3.32% of its value against the British Pound after descending through a rising range of support from November 2018. In its path lower, EUR/GBP cleared through multiple ranges of horizontal support on the daily chart below and now the pair is sitting right on the April 2018 lows above 0.862. This may be the last barrier separating it from 2017 lows just above 0.83. A break through 0.862 opens the door to extending its near-term downtrend.
If the currency pair descends through it, multiple Fibonacci extension levels may present themselves as support. Starting with the 78.6% one at 0.859, falling through it opens the door to testing the 123.6% extension at 0.8434. Another obstacle around that area may be the descending range of support (downward sloping parallel pink lines on the chart below). During the latter half of 2017 through April 2018, these lines appeared to tame EUR/GBP’s descent.
EUR/GBP might also struggle descending through 0.862 and turn higher. Near-term resistance is a horizontal range in-between 0.86683 – 0.86983. Pushing above that exposes the 38.2% extension around 0.87299. You may follow me on Twitter @ddubrovskyFX for more immediate real-time coverage of EUR/GBP and other currency crosses.
EUR/GBP Daily Chart

**Charts created in TradingView
FX Trading Resources
- Join a free Q&A webinar and have your trading questions answered
- Just getting started? See our beginners’ guide for FX traders
- See our free guide to learn what are the long-term forces Euro prices
- See how the British Pound and Euroare viewed by the trading community at the DailyFX Sentiment Page
--- Written by Daniel Dubrovsky, Junior Currency Analyst for DailyFX.com
To contact Daniel, use the comments section below or @ddubrovskyFX on Twitter


