


EUR/GBP Technical Analysis
- Brexit fundamentals propel EUR/GBP higher despite bearish technical signals
- Ascent through the August highs would be very bullish, for now it is resistance
- Rising support line from November is helping to keep the uptrend intact for now
Just started trading EUR/GBP? Check out our beginners’ FX markets guide !
Towards the end of last week, I noted fading upside momentum in EUR/GBP which warned that prices might have been on the verge of turning lower. Sometimes though the fundamentals can overpower technical signals and since we last looked at EUR/GBP, this ended up being the case. The latest Brexit news sent the British Pound depreciating across the board.
This resulted in EUR/GBP closing at its highest since August as the pair blew through critical resistance barriers within the span of 24 hours. Monday’s performance was also the most impressive day of gains (+1.14%) in almost one month. So, where does this leave the Euro standing against the British Pound from a technical perspective and what could be its next stop?
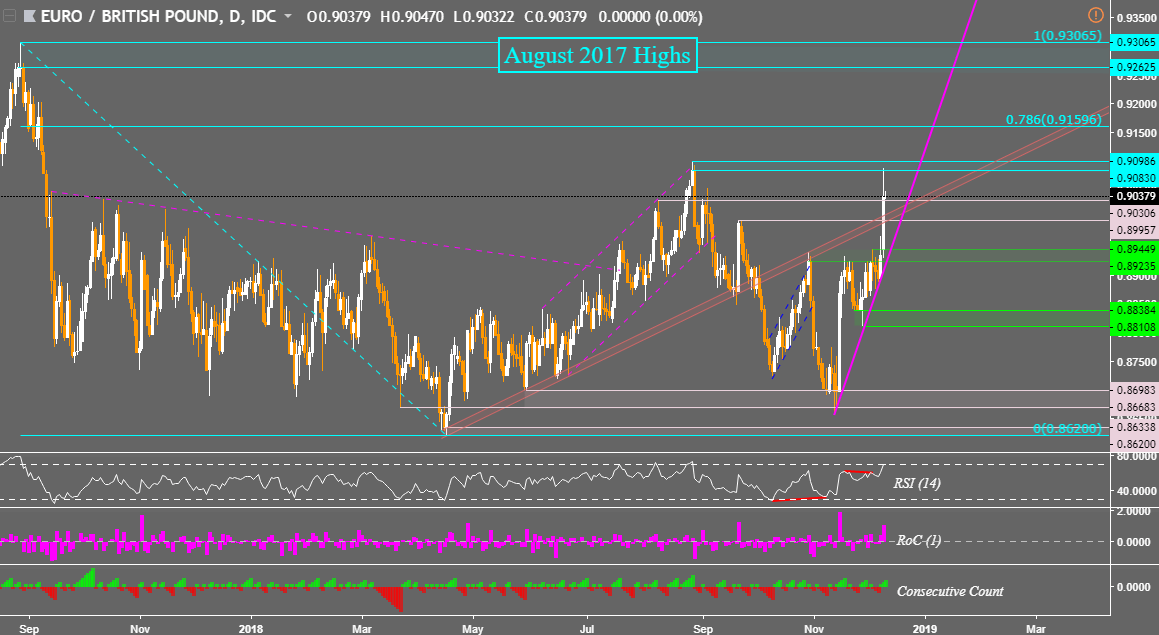
Well for one thing, we haven’t cleared the late August highs between 0.9083 and 0.9098 even though an attempt was made. From where EUR/GBP closed on Monday, this area stands as near-term resistance on the daily chart. Pushing above would be bullish as it exposes the August 2017 highs between 0.9262 and 0.9306. But getting there would first involve clearing the 78.6% Fibonacci retracement at 0.9159.
Meanwhile we now have a rising trend line from November that may act as support should EUR/GBP prices turn lower in the interim. A descent through it would be bearish if it is followed with confirmation. For now, the pair is sitting just above horizontal support at 0.9030. Just below that is a combination of the September 21st high and a rising support channel from April 2018.
Often, I will tweet about major breakouts in EUR/GBP before writing an article about it that offers my outlook. You may follow me on Twitter @ddubrovskyFX for more immediate updates on EUR/GBP.
EUR/GBP Daily Chart
**Charts created in TradingView
FX Trading Resources
- Join a free Q&A webinar and have your trading questions answered
- Just getting started? See our beginners’ guide for FX traders
- See our free guide to learn what are the long-term forces Euro prices
- See how the British Pound and Euroare viewed by the trading community at the DailyFX Sentiment Page
--- Written by Daniel Dubrovsky, Junior Currency Analyst for DailyFX.com
To contact Daniel, use the comments section below or @ddubrovskyFX on Twitter


