


EUR/GBP Technical Analysis
- EUR/GBP consolidation mode solidifies as traders eagerly await a breakout
- Negative RSI divergence warns prices may turn lower on fading momentum
- Horizontal range support breakout exposes eventually testing the 2018 lows
Just started trading EUR/GBP? Check out our beginners’ FX markets guide !
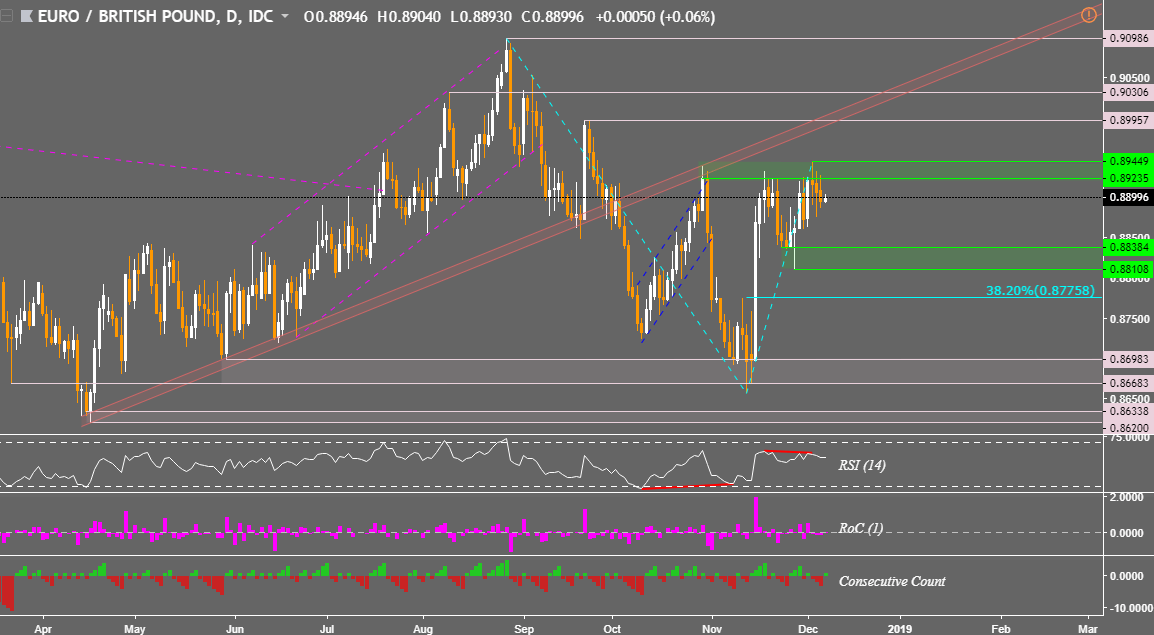
Last week, the Euro entered consolidation mode against the British Pound after what appeared to be a false breakout above a falling trend line from August. Since then, the range of price action has solidified as traders eagerly await a breakout. The upper boundary of resistance is a horizontal range between 0.89449 and 0.89235. Meanwhile the lower border is between 0.88384 and 0.88108.
There is an early warning signal that EUR/GBP’s next leg might be lower. Negative RSI divergence has appeared during the pair’s attempt to break above the range of resistance. This shows that upside momentum is ebbing and that the push higher is becoming more and more of a struggle. With that in mind, EUR/GBP may find itself soon testing consolidation support.
Should the pair manage to break under 0.88108, it could be heading for a resumption of the downtrend from August to November. Before reaching the lows of November (0.86983 – 0.86683) however, Chunnel may find itself stopping for a break at the 38.2% Fibonacci extension at 0.87758. If these two areas of interest fail to tame the pair, it won’t be much longer until the 2018 lows are tested thereafter.
In the event EUR/GBP finds itself climbing instead, the pair faces a rising range of former support from April. This area is also closely aligned with the September 21st high at 0.89957. Rising above that would open the door to testing the 2018 high at 0.9086. If you are awaiting news of a breakout, you may follow me on Twitter @ddubrovskyFX for real time updates in the interim.
EUR/GBP Daily Chart
**Charts created in TradingView
FX Trading Resources
- Join a free Q&A webinar and have your trading questions answered
- Just getting started? See our beginners’ guide for FX traders
- See our free guide to learn what are the long-term forces Euro prices
- See how the British Pound and Euro are viewed by the trading community at the DailyFX Sentiment Page
--- Written by Daniel Dubrovsky, Junior Currency Analyst for DailyFX.com
To contact Daniel, use the comments section below or @ddubrovskyFX on Twitter


