


EUR/GBP Technical Analysis
- EUR/GBP appears to be transitioning into a consolidation mode for the time being
- Upper boundary of the range around 0.89394 while the lower one is near 0.88108
- A climb above the range exposes 2018 high, a descent meanwhile eyes April lows
Just started trading EUR/GBP? Check out our beginners’ FX markets guide !
Since we last took a look at EUR/GBP, the pair was struggling to confirm a break above a falling trend line from August. Confirmation via more closes to the upside could have meant a lasting uptrend to come. But, that was not the case as anticipated. The pair fell instead, but lasting downside progress was not achieved and we are now back to where we left off.
With that in mind, the Euro appears to be transitioning into a consolidation mode against the British Pound. EUR/GBP is sitting squarely at the edge of a horizontal range of resistance between 0.89235 and 0.89394. Looking below, near-term horizontal support is between a range of 0.88384 and 0.88108. Until we get a clear cut push outside of either barrier, more oscillation may be in store next.
In the event that either barrier is breached, it could carry with it implications of the next dominant trend. With prices at resistance, let’s take a look at where a push higher could lead to. First up would be a rising range of support (red channel on the chart below) that was first broken in early October and retested at the end of the same month. Sitting above that is the September 21st high at 0.89957.
Ascending through those areas of interest may eventually lead to a test of the August 28th high at 0.90986 which is currently the 2018 peak. Conversely, a descent through support exposes the 38.2% Fibonacci extension at 0.87634. Beyond that lies another horizontal range of support, but this one is between 0.86983 and 0.86683. Closing under this area would open the door to an 8-month low.
EUR/GBP Daily Chart
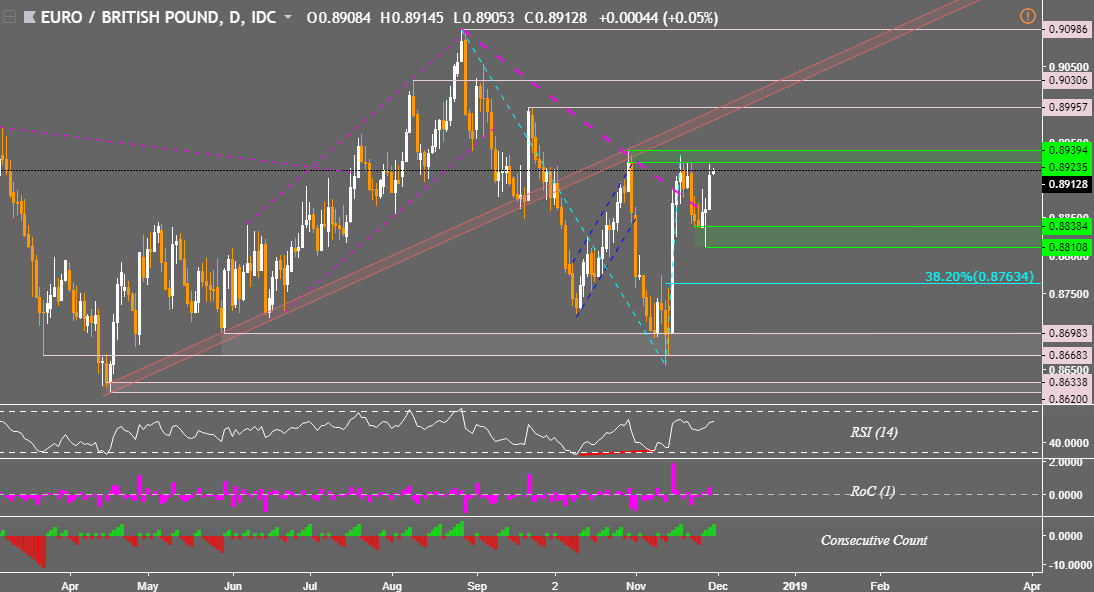
**Charts created in TradingView
FX Trading Resources
- Join a free Q&A webinar and have your trading questions answered
- Just getting started? See our beginners’ guide for FX traders
- See our free guide to learn what are the long-term forces Euro prices
- See how the British Pound and Euroare viewed by the trading community at the DailyFX Sentiment Page
--- Written by Daniel Dubrovsky, Junior Currency Analyst for DailyFX.com
To contact Daniel, use the comments section below or @ddubrovskyFX on Twitter


