


The current pricing model in GBP/USD suggests we are in a terminal and ending wave to the upside at multiple degrees of trend.
In June, we wrote:
“If the 1.3048 high breaks, then 1.3450 becomes the next significant level of resistance. Our model suggests 1.3450 may be strong enough to contain prices over the coming quarter.”
2
GBP Forecast Q3 (download here)
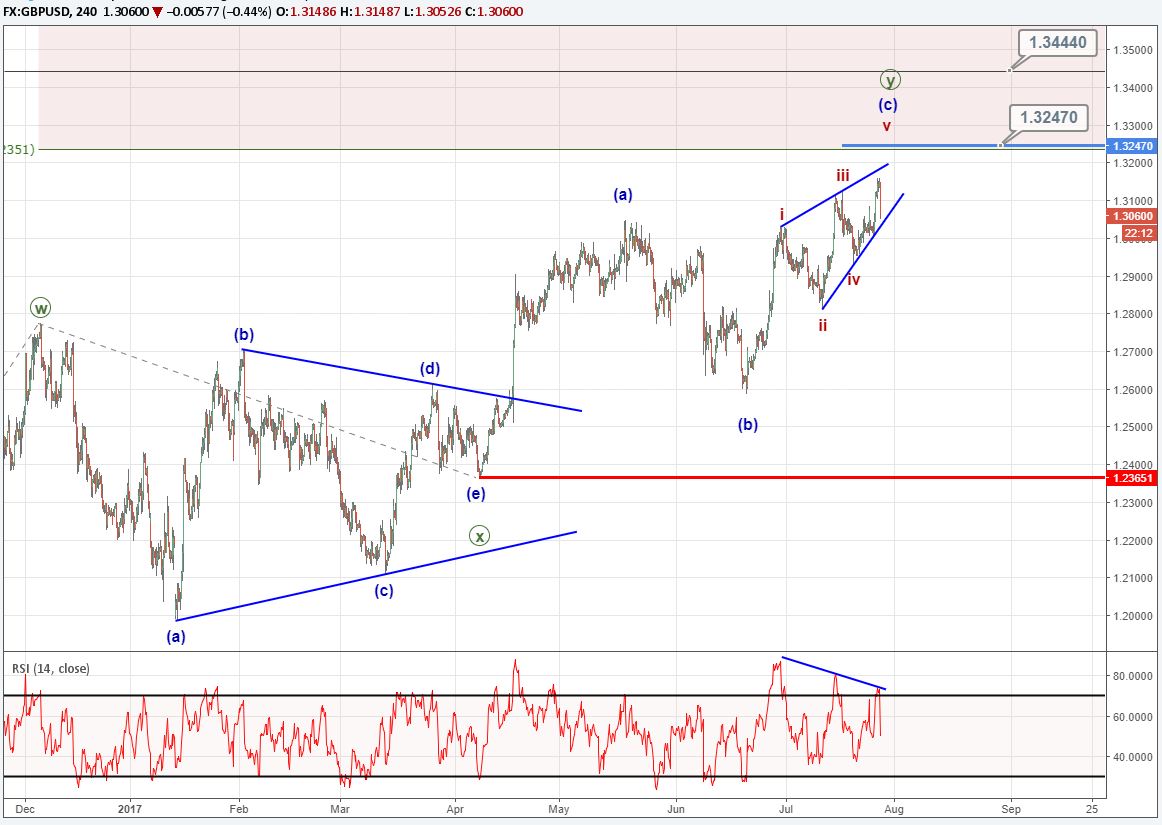
The updated Elliott Wave model we are following hints that prices may not make it up to 1.3450.
We appear to be in a ‘Y’ wave of a W-X-Y complex upward correction. Wave ‘Y’ began on April 7, 2017 and is constructed of three waves labeled (a)-(b)-(c).
“Y” Waves
‘Y’ waves of a complex correction are oftentimes an ending wave, though they do not have to be. However, in Cable’s W-X-Y combination of patterns, the ‘X’ wave is a triangle. We learned from our Elliott Wave Triangle webinar that triangles precede the last actionary wave of the sequence. What this means in simple terms is that the triangle is the second to last wave of the sequence. Therefore, we can imply the current move higher from April 7 is likely to be the final and terminal wave of the sequence.
(Learn more about Elliott Wave Triangles in this webinar recording.)
Within the ‘Y’ wave, it appears we are within the (c) wave that is another terminal and ending wave of the sequence. The ‘Y’ wave appears to be taking shape as a zigzag with the (c) wave ending diagonal. Ending diagonals are one of my favorite patterns because they can offer good risk to reward ratio trading opportunities. For this ending diagonal to be accurate under the rules of Elliott Wave Theory, GBP/USD would need to reverse lower below 1.3247. If the wave count as labeled above is correct, then this reversal may ultimately retest 1.19. As a result, bears may re-emerge soon in this market.
If sentiment increases then it would suggest the shift in trend. The live sentiment reading currently shows -1.45. A positive shift towards sentiment is a subtle bearish signal as we use sentiment as a contrarian type of indicate. View the live sentiment reading and learn more about how to trade with sentiment on our IG Client Sentiment page.
Bottom line, a break below 1.2978 does hint the top has been established so short traders can watch that level with interest. A break lower may begin a trend shift that retests 1.19. Prices would need to remain below 1.3247 for the ending diagonal pattern to remain in place. Above 1.3247, the longer term bearish view remains in place and we will watch how 1.3450 behaves (mentioned in the quarterly forecast).
(Learn more on Elliott Wave Diagonals patterns by watching this webinar recording.)
---Written by Jeremy Wagner, CEWA-M
Discuss this market with Jeremy in Monday’s US Opening Bell webinar.
Follow on twitter @JWagnerFXTrader .
Join Jeremy’s distribution list.


