


US Dollar, USD/SGD, USD/PHP, USD/THB, USD/IDR – ASEAN Technical Analysis
- The US Dollar weakened against ASEAN currencies this past week
- USD/SGD, USD/PHP and USD/THB could be poised for more losses
- USD/IDR is relatively holding up, keep an eye on a key moving average

Singapore Dollar Technical Outlook – Bearish
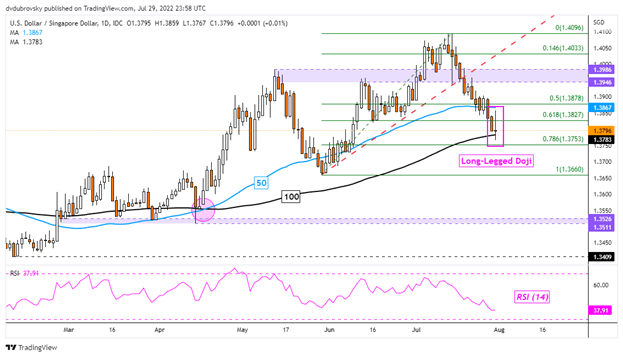
The US Dollar saw its worst 2-week performance against the Singapore Dollar since September 2020. This brought USD/SGD to its lowest since early June after breaking under the near-term rising trendline from May. Now, prices are testing the 100-day Simple Moving Average (SMA) after the pair left behind a Long-Legged Doji candlestick pattern. This is a sign of indecision. Further upside gains could spell a turning point. But it seems that the trend is pointing lower. Subsequent support seems to be the 78.6% Fibonacci retracement at 1.3753 before the May low at 1.3660 comes into play.
USD/SGD Daily Chart
Philippine Peso Technical Outlook – Bearish
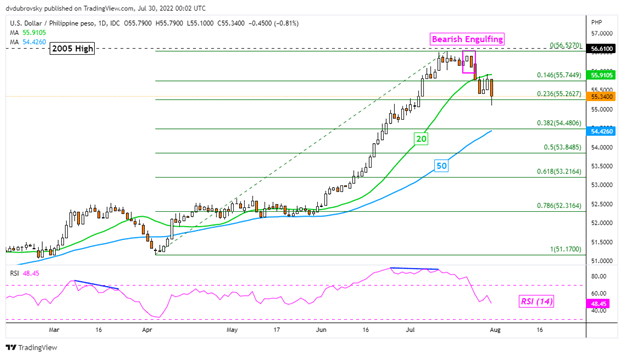
The US Dollar fell 1.65% against the Philippine Peso over the past 2 weeks. That was the worst 10-day outcome since May 2020, setting up for more losses ahead. This followed the emergence of a Bearish Engulfing candlestick pattern – as expected. USD/PHP confirmed a breakout under the 20-day SMA, exposing the 50-day line. Getting to the latter entails clearing immediate support, which is the 23.6% Fibonacci retracement at 55.2627. Uptrend resumption entails a pivot and subsequent breakout above the 2005 high at 56.61.
USD/PHP Daily Chart
Thai Baht Technical Outlook – Slightly Bearish
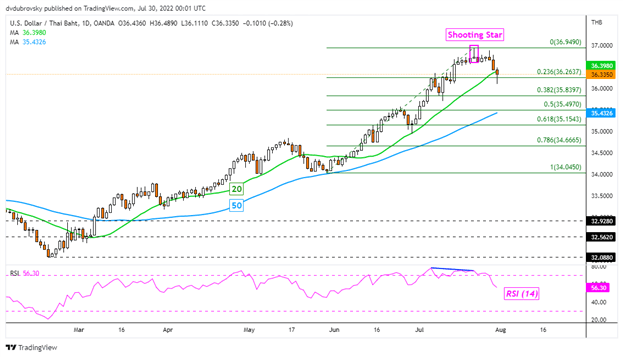
The US Dollar also slipped against the Thai Baht this past week. USD/THB fell 0.82%, marking the worst 5-day performance since May. Prices closed under the 20-day SMA after a Shooting Star candlestick pattern emerged. Follow-through is lacking. Subsequent losses could open the door to extending the drop, offering a stronger bearish conviction. Such an outcome would place the focus on the 50-day SMA. Otherwise, uptrend resumption entails a close above 36.949.

USD/THB Daily Chart
Indonesian Rupiah Technical Outlook – Neutral
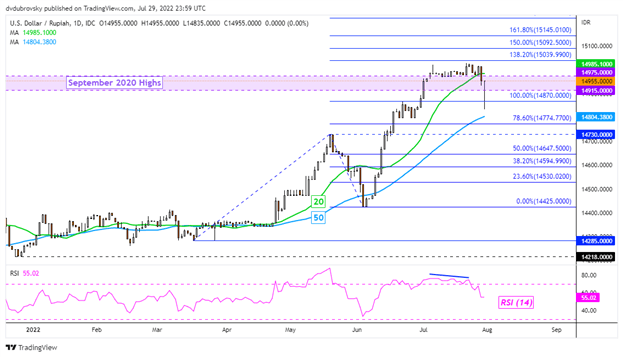
The US Dollar cautiously weakened against the Indonesian Rupiah this past week. USD/IDR closed under the 20-day SMA, but follow-through appears to be somewhat lacking. A further downside close could open the door to extending losses, placing the focus on the 50-day SMA. Otherwise, key resistance above appears to be highs from September 2020. Resuming the uptrend would expose the 138.2% Fibonacci extension at 15039 before 15092 comes into focus.
USD/IDR Daily Chart
--- Written by Daniel Dubrovsky, Strategist for DailyFX.com
To contact Daniel, use the comments section below or @ddubrovskyFX on Twitter
Trade Smarter - Sign up for the DailyFX Newsletter
Receive timely and compelling market commentary from the DailyFX team


