


Dow Jones, S&P 500, Nasdaq 100, Technical Analysis – Week Ahead
- Dow Jones upward momentum keeps slowing, but broader trend bullish
- S&P 500 futures facing potential bearish Double Top chart formation
- Nasdaq 100 may have more room lower before facing key support levels
Trade Smarter - Sign up for the DailyFX Newsletter
Receive timely and compelling market commentary from the DailyFX team
Dow Jones Technical Outlook - Neutral
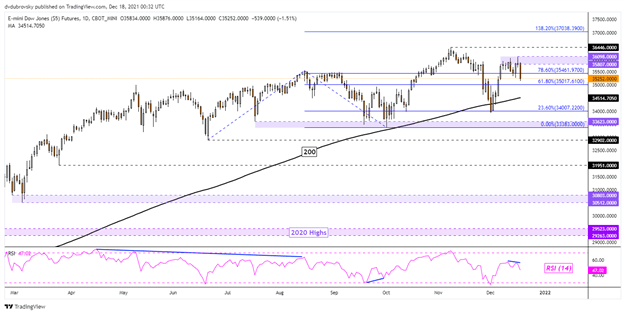
Even though the Dow Jones remains in a broader uptrend since March 2020, prices remain close to levels last seen in May of this year. Indeed, the index’s uptrend this year has been progressively slowing. The latest bout of market volatility followed the last Federal Reserve interest rate decision of this year, where the central bank offered a notable hawkish pivot to its outlook.
The latest price action in the Dow left it rejecting the 35807 – 36098 resistance zone, closing under the 50-day Simple Moving Average and the 78.6% Fibonacci extension at 35461. This leaves Dow futures facing the downside heading into the final few weeks of the year. Still, prices remain above the longer-term 200-day Simple Moving Average, which is maintaining the broader upside focus.
In the event prices weaken ahead and close under the 200-day line, follow-through will be key. To that end, keep a close eye on the 3383 – 33623 support zone. The latter has been in play since July. Uptrend resumption entails a pass above 36446. Do keep an eye on RSI. Negative divergence could emerge, showing fading upside momentum, undermining progress higher.
S&P 500 Technical Analysis - Neutral
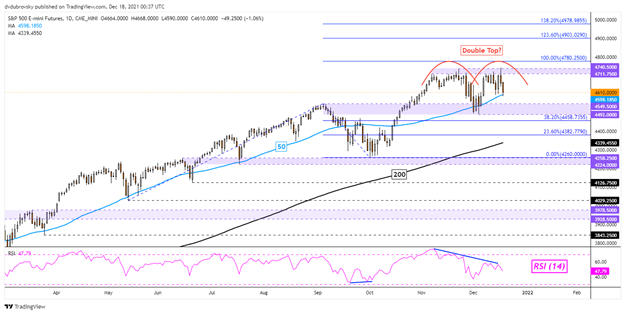
S&P 500 futures once again rejected the 4740 – 4711 resistance zone this past week. This range has been keeping upside progress at bay since late October. Negative RSI divergence has also been persistent, hinting at a turn lower. This could be the next move for the S&P 500, especially with a bearish Double Top chart formation brewing.
Still, follow-through is key. The neckline of the Double Top seems to be the 4492 – 4549 support zone. A breakout under this range could make the chart formation active, hinting at further downside losses. In such an outcome, the 200-day SMA will likely come into focus. This could still maintain the broad upward focus. Resuming the uptrend places the focus on the 123.6% Fibonacci extension at 4903.
Introduction to Technical Analysis
Learn Technical Analysis
Recommended by Daniel Dubrovsky
Nasdaq 100 Technical Analysis - Neutral
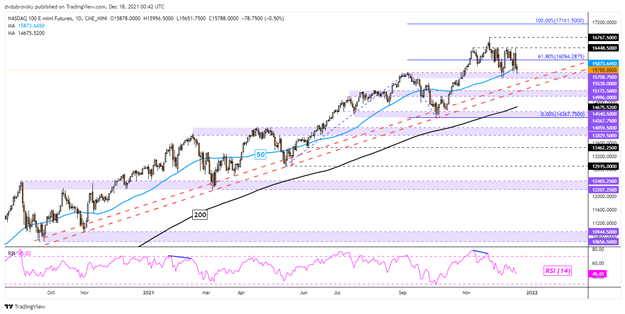
Nasdaq 100 futures have also been quite wobbly as of late, with prices still below the all-time high of 16767 set in late November. However, a rising trendline from September 2020 continues to maintain the dominant uptrend – red lines on the chart below. Even beyond the trendline is the 200-day SMA. This hints that there may be more room left to the downside before prominent technical levels come into play.
Immediate support seems to be the 15538 – 15708 inflection zone, where taking it out exposes the trendline. To the upside, immediate resistance is the 16448 inflection point. This is a price that stands in the way of the Nasdaq retesting the all-time peak. Extending the uptrend exposes the 100% Fibonacci extension at 17161.
--- Written by Daniel Dubrovsky, Strategist for DailyFX.com
To contact Daniel, use the comments section below or @ddubrovskyFX on Twitter


