


S&P 500, Nasdaq Talking Points:
- Both the S&P 500 and Nasdaq are so far down on the week after displaying some astounding resiliency earlier in the month.
- Tomorrow brings the FOMC and the wide expectation is that the bank will begin to make a move towards a more-hawkish outlook, with warning of rate hikes for next year. But, how many hikes will the Fed signal, and just how aggressive will they be? Equity markets appear cautious and expectations are high for how many rate hikes are expected via the dot plot matrix tomorrow. I look at rate hike probabilities a little later in this article.
- The analysis contained in article relies on price action and chart formations. To learn more about price action or chart patterns, check out our DailyFX Education section.

Stocks opened the week very near some key resistance. But with a massively important FOMC rate decision on Wednesday, bulls couldn’t find the strength to test through those inflection points on the chart and prices are pulling back ahead of the big day tomorrow.
To be sure, there’s been brewing bearish potential in equities for a few weeks now. The S&P 500 and Nasdaq both set fresh all-time-highs on November 22nd, just ahead of the Thanksgiving holiday. And then news of the Omicron variant began to make its way across markets and that led to a brutal half-day of trade on Black Friday.
But it was the news the following week that continues to loom large, and that’s when both Janet Yellen and Jerome Powell had some comments concerning inflation and, in-turn, FOMC monetary policy that started to catch the attention of market participants. At the twice-annual Humphrey Hawkins testimony, Powell moved to retire the world ‘transitory’ which was seen as the Fed waving the white flag on the inflation that they’ve tried to ignore for much of the year. This provided a quick jolt to equities that saw stocks trade lower, driven by the fear that the Fed was going to get much more hawkish at their upcoming rate decisions.
And then last Friday, CPI printed at 6.8%, another fresh 39-year high. But, equities powered through and seemed undeterred by that data point with last prices in both the Nasdaq 100 and S&P 500 closing very near key inflection points.
That’s changed so far this week as yesterday saw a wave of selling develop, and that’s so far extending into this morning. At this point, it appears that traders are tightening up ahead of the rate decision and that makes sense given the potential for a change in policy if not tone from the FOMC.
S&P 500 Four-Hour Price Chart
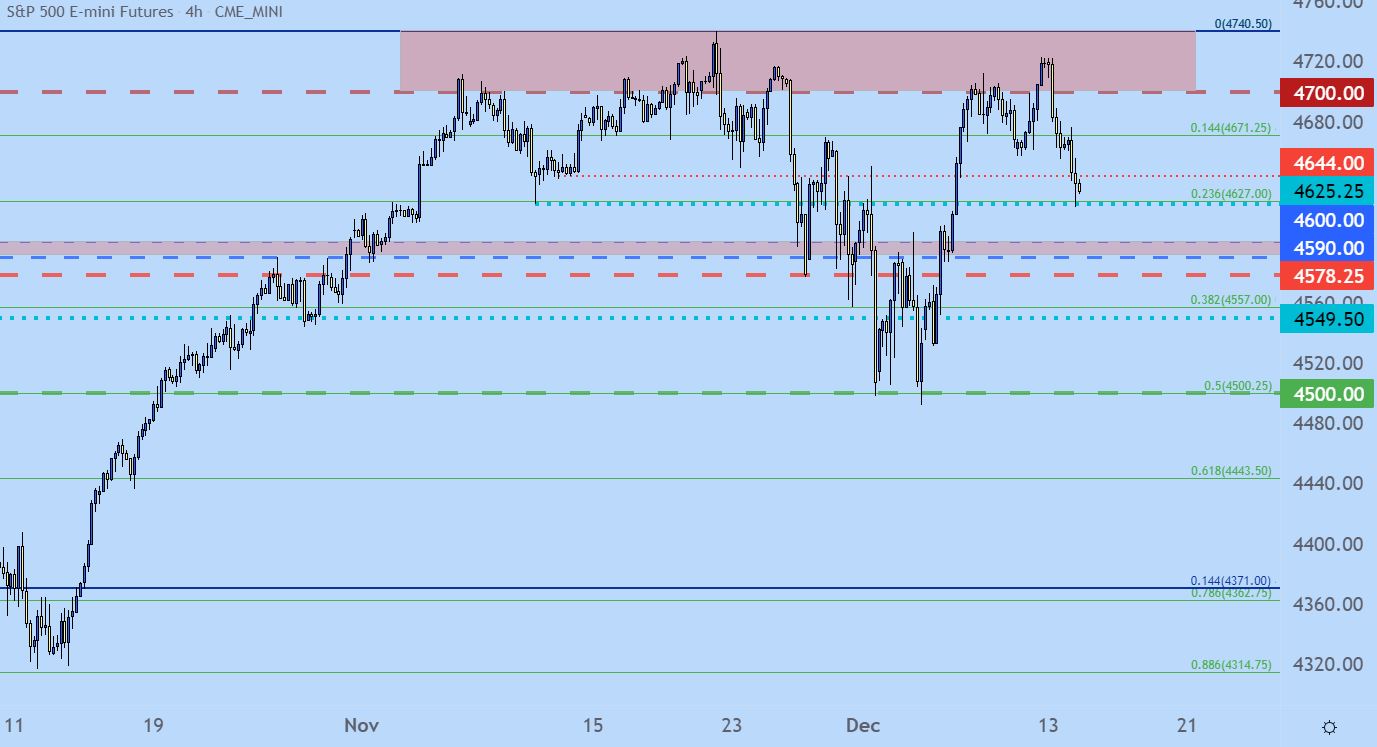
Chart prepared by James Stanley; S&P 500 on Tradingview
The Big Question
Will the Fed pick up the pace of asset purchases and, perhaps more importantly, how many rate hikes will they see on the horizon for 2022 trade?
At the September rate decision, the Fed surprised markets by forecasting one rate hike for 2022. This created a quick swell of strength in the US Dollar with stocks turning lower, eventually bottoming out on October 1st.
Per CME Fedwatch, expectations are very high for a more-hawkish Fed, with the median expectation holding at three hikes in 2022, as of this writing, with a 61.5% probability of at least three hikes next year.
There’s also a 31.8% probability of at least four rate hikes next year, which sounds unrealistic to me, personally, but this highlights how incredibly high the bar has been set. And for a Fed that has been going out of their way to support markets and this rally, going so far as to dismiss 30-year high inflationary reads, it sounds unrealistic that the bank will all-of-the-sudden change tact so fast. But, those are the numbers as of this morning.
Target Rate Probabilities for Dec, 2022 Fed Meeting: High Expectations for Higher Rates
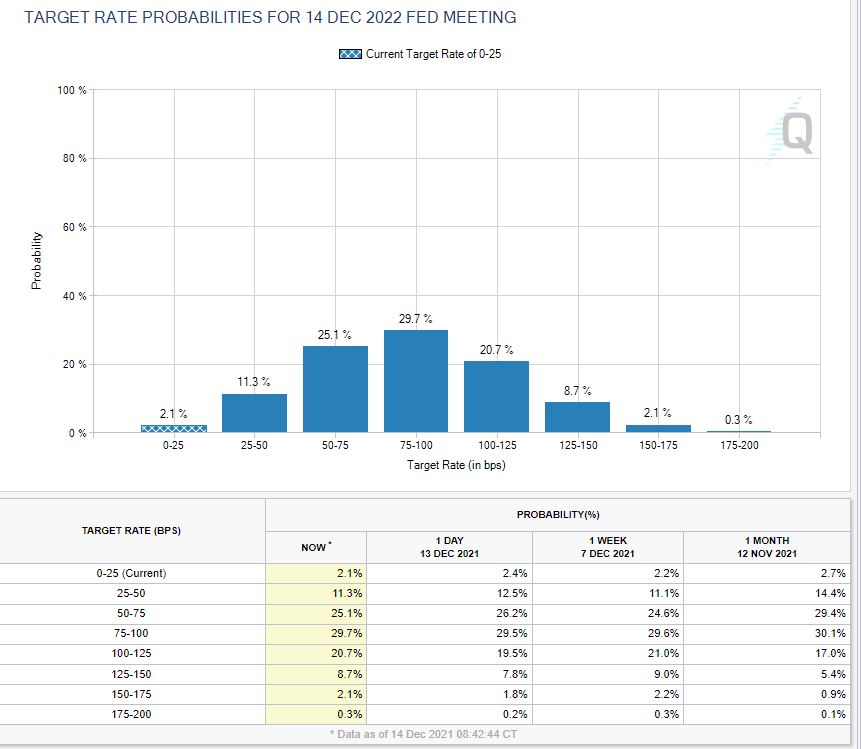
Chart prepared by James Stanley; data from CME Fedwatch (link above)
There’s so far been a dearth of bullish price action above the 4700 psychological handle on the S&P 500 since it first came into play in early-November. This can be illustrative of an overbought market lacking motivation, and with tomorrow’s FOMC rate decision on the calendar it makes sense as to why trend followers might be reticent to bid the index higher ahead of the event.
But, so far, bulls have remained strong, buying the dip in late-November/early-December which had some forward drive from the Omicron scare. This isn’t quite an inverse head and shoulders pattern but it soon could be, and similarly this would keep the door open for bullish breakout potential beyond that big figure.
For this to happen, the Fed will likely need to trot out the ‘transitory’ narrative again, with a dot plot matrix indicating two rate hikes or less for 2022. Otherwise, we might be looking at another test of the lows, and there’s key support zones in the S&P 500 around psychological levels at 4500 and 4600.
Failure to hold 4500, however, could lead to a precipitous decline.
S&P 500 Eight Hour Price Chart
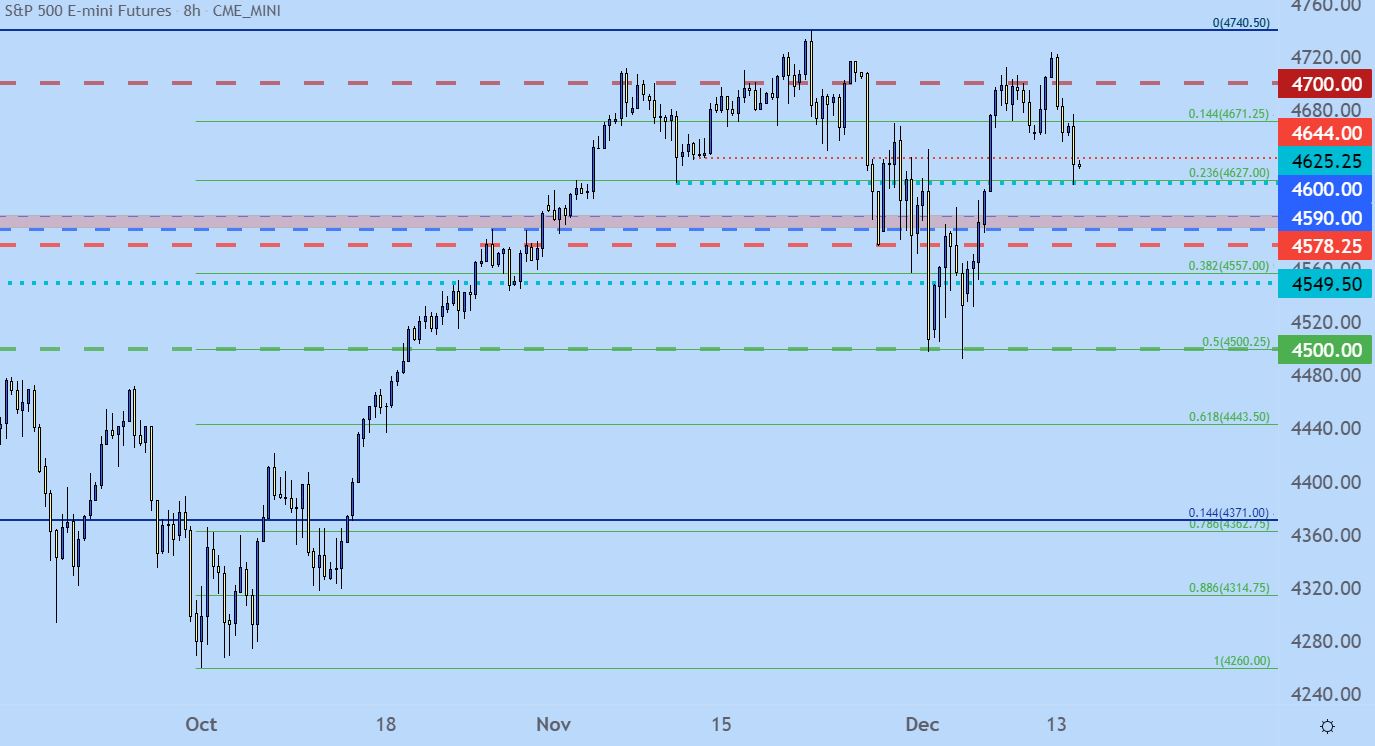
Chart prepared by James Stanley; S&P 500 on Tradingview
Nasdaq 100
If we do see a Fed-induced sell-off tomorrow, the Nasdaq 100 is perhaps more interesting than the S&P 500. The index flew-higher on the back of the low rates theme and as higher rates started to come into the picture this year, the tech-heavy Nasdaq displayed a greater sensitivity to that theme.
But, with that said, a similar formation has presented itself in the index, with a line-in-the-sand around the 16,421 level that was in-play around this week’s open.
Similar to the S&P 500 with 4700, bulls have been unable to punch-above this key spot on the chart, and this has led to a slide back down to prior support zones – the same that were in-play over the past two weeks. There’s a major spot around 15,800, with another around 15,600. A breach of 15,500 opens the door for a run down to the 15,300 level.
Nasdaq 100 (NQ) Eight-Hour Price Chart
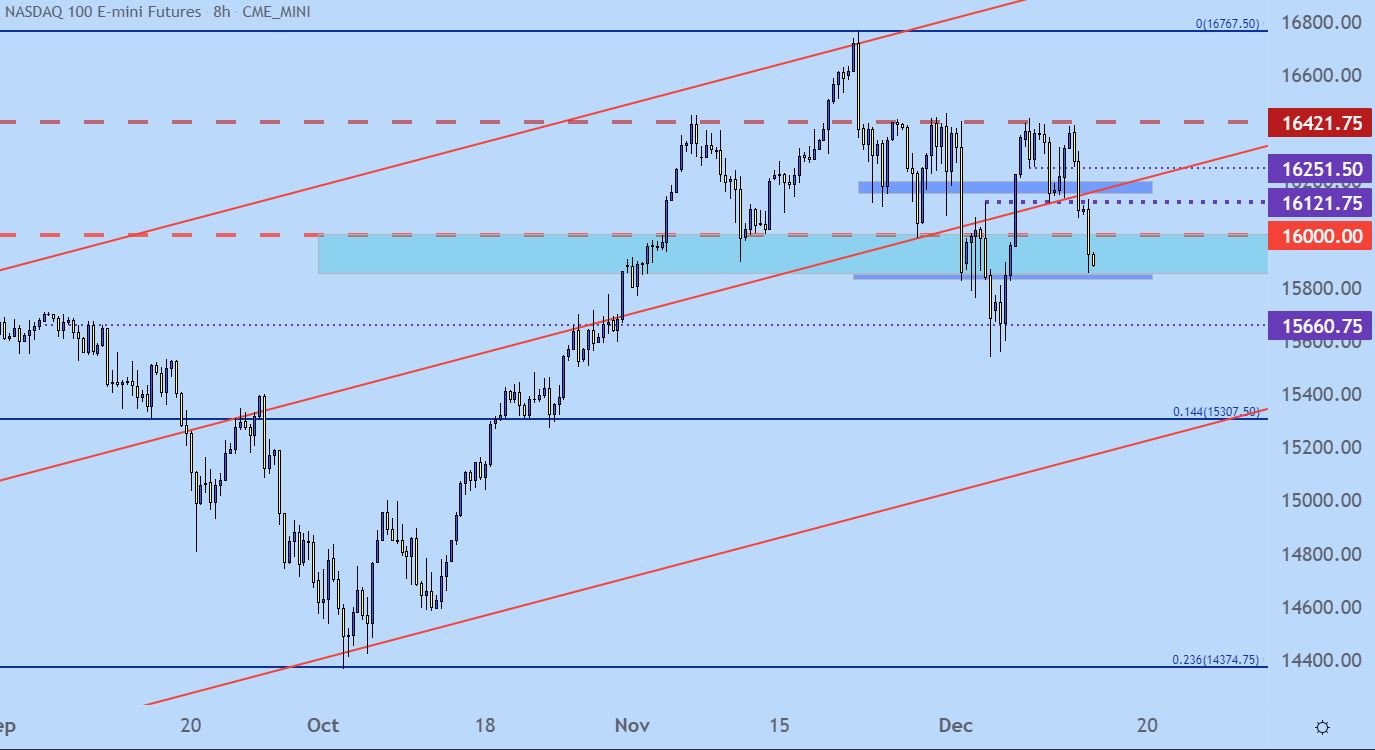
Chart prepared by James Stanley; Nasdaq 100 on Tradingview
Nasdaq 100 Longer-Term Channel in-Play
This is worthy of mention given that we may be nearing a spot for the bullish trend to face a bit of pressure.
There’s a bullish price channel that’s been holding Nasdaq 100 price action for more than a year now. We haven’t seen a support inflection since early-October, and this currently projects to around 15,200. So, even if there is a 15,300 breach, the longer-term bullish trend could still retain some potential.
It’s not until the 14,374 level is tested through that we can look at bigger picture bearish initiatives on the index, at which point a larger-scale unraveling may be ahead of us.
Nasdaq 100 Daily Price Chart

Chart prepared by James Stanley; Nasdaq 100 on Tradingview
--- Written by James Stanley, Senior Strategist for DailyFX.com
Contact and follow James on Twitter: @JStanleyFX


