


Dow, Nasdaq 100, S&P 500 Forecasts: Bearish
- This was a big week for stocks, with all three major U.S. indices falling as a couple of key risk factors took center-stage.
- While the Omicron variant carries a lot of unknowns, the Fed made a clear move towards more-hawkish policy this week, and with the unemployment rank sinking below the 4.5% marker for ‘maximum employment,’ the bank may be even closer to tighter policy in the effort of stemming inflation.
- The analysis contained in article relies on price action and chart formations. To learn more about price action or chart patterns, check out our DailyFX Education section.

Have bears finally made their long-awaited appearance back into U.S. equities? After a spill in September, pushed along by fears around Evergrande out of China, stocks put in a strong topside move from mid-October into another fresh all-time-high, set in late-November. But that’s about the time that another set of risks entered the equation, and at this point there’s multiple risk factors at-play with both the Omicron variant and the potential for a hawkish twist in Fed policy.
That shift in Fed policy isn’t completely by surprise, however, as the stage has been setting for such a shift throughout this year. Even with inflation running higher, the Fed continued to say that they thought it was transitory and would soon abate. That hasn’t so far shown in the data and just a couple of days after that high was set, Treasury Secretary Janet Yellen had some sharp words on the matter of inflation, warning that the Fed would not allow inflation to become ‘endemic,’ inferred to mean the bank would take a more-hawkish tone towards the matter.
Along the way, the FOMC has been pointing to employment as the primary reason for staying pedal-to-the-floor with policy. Well, today’s NFP report saw the unemployment rate print at 4.2%, below the Fed’s threshold of 4.5% to mark ‘maximum employment.’ So the out that’s allowed the bank to stay aggressively loose with policy is no more, and this seemingly makes prospects of a hike look even stronger, at least just from the logical facts that have been presented.
There’s but one problem: Rates markets do not agree. On the heels of this morning’s NFP release, the 10-year Treasury yield dropped to a fresh two-month-low. So, rates are going in the opposite direction of what the FOMC wants. This would be similar to Q4 of 2018, when the FOMC was nearing the end of their hiking cycle. While warning of two more hikes at the December rate decision, the 10-year continued to see yields fall, all the way into the second-half of 2019; and at that point they’d already started cutting rates twice.
With inflation remaining brisk, even evidenced in the NFP report with Average Hourly Earnings printing at 4.8%, will the Fed have much of a choice? It seems like the bank is being pushed further and further into a corner, and this could be a negative for stocks. And normally lower rates provide some optimism in stocks, but that was seemingly missing this week as lower yields were also accompanied by yield curve compression.
S&P 500
The S&P 500 started to show symptoms of a turn on Black Friday, just as news about the Omicron variant had hit the headlines. That led into a bounce on Monday that had held into the Tuesday open, but that’s when Powell’s testimony took many by surprise which led to a another bearish move in stocks. That continued through Wednesday, with a bounce on Thursday finding resistance at the familiar 4590-4600 zone on the chart.
The Friday NFP report, combined with that resistance, helped to set the stage for sellers with another fast reversion back to the 4500 level, which helped to hold the low on Friday before a late-session bounce saw prices bump back up towards the 4550 zone of prior resistance.
This keeps the door open for sellers next week, looking for a breach of the 4500 spot on the chart. For near-term resistance, watch 4550, and a topside breach of 4600 could be seen as invalidation of the near-term bearish theme.
S&P 500 Daily Price Chart
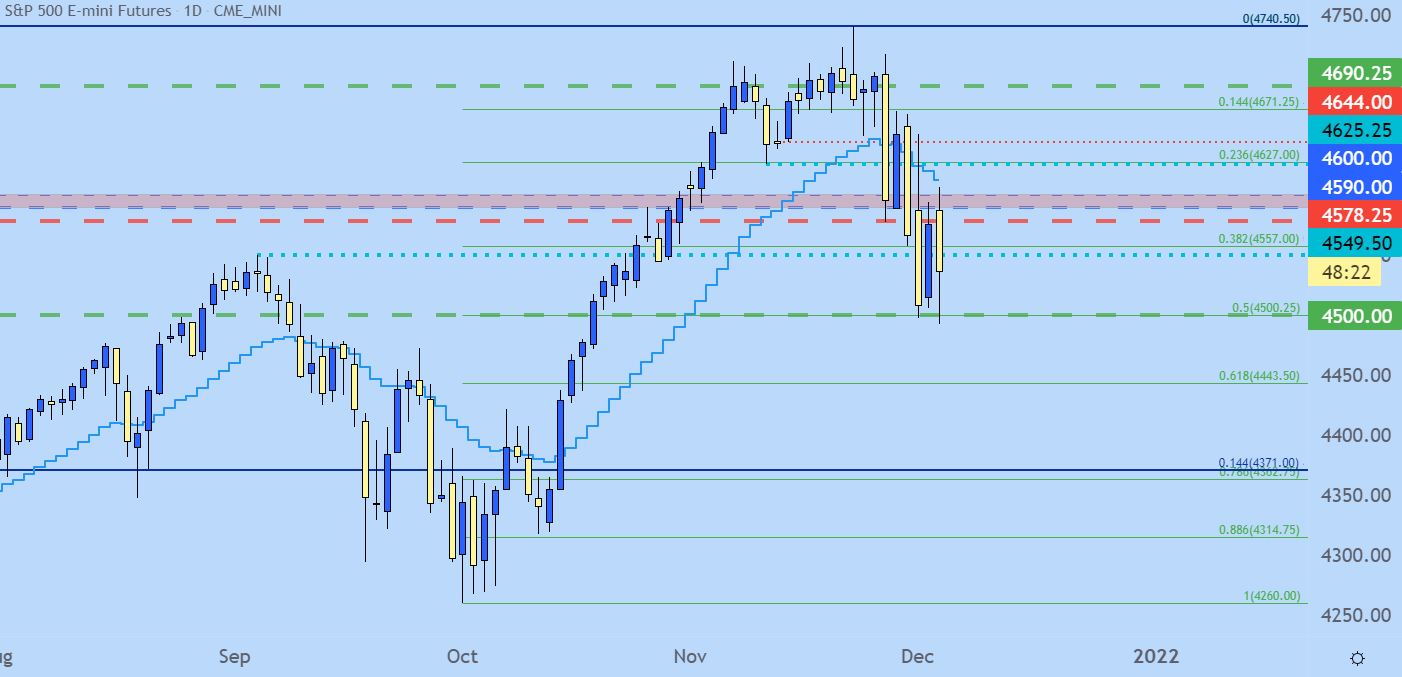
Chart prepared by James Stanley; S&P 500 on Tradingview
Nasdaq 100
The Nasdaq 100 set its recent high on November 22, right around the time of that Yellen comment regarding inflation. But, the past week produced a similarly volatile backdrop with perhaps even more of a bearish bias beginning to show.
At this point the Nasdaq 100 has retraced as much as 50% of the topside move that took six weeks to build from early-October into mid-November. That retracement level came in as key on Friday, helping to hold the lows before a late-session bounce ahead of the close. There’s a big spot of confluent support a little lower, around the 61.8% Fibonacci retracement and plotted around 15,300. For near-term resistance, the 38.2% retracement of that major move remains of interest, up to the 16k psychological level.
Nasdaq 100 Daily Price Chart
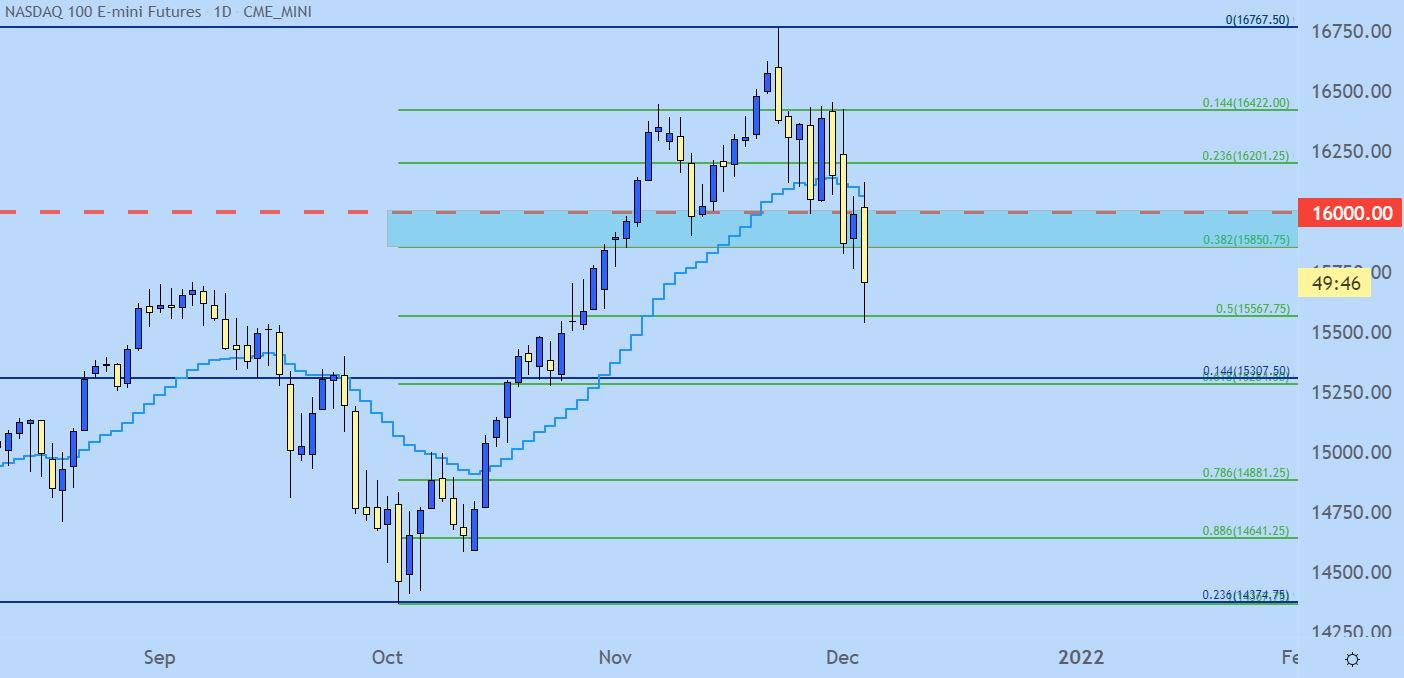
Chart prepared by James Stanley; Nasdaq 100 on Tradingview
Dow Jones
The Dow was a bit slower on the way up and, at this point, the index is much closer to a re-test of the October low than either of the above two indices. But, the late session rally on Friday helped to build a doji on the weekly chart, indicating more indecision than anything, and this could make the index a bit less attractive for trending strategies in either direction. On the long side, a breach of 34934 re-opens the door for strength while a break below support at 33623 opens the door for bearish scenarios.
Dow Jones Weekly Price Chart
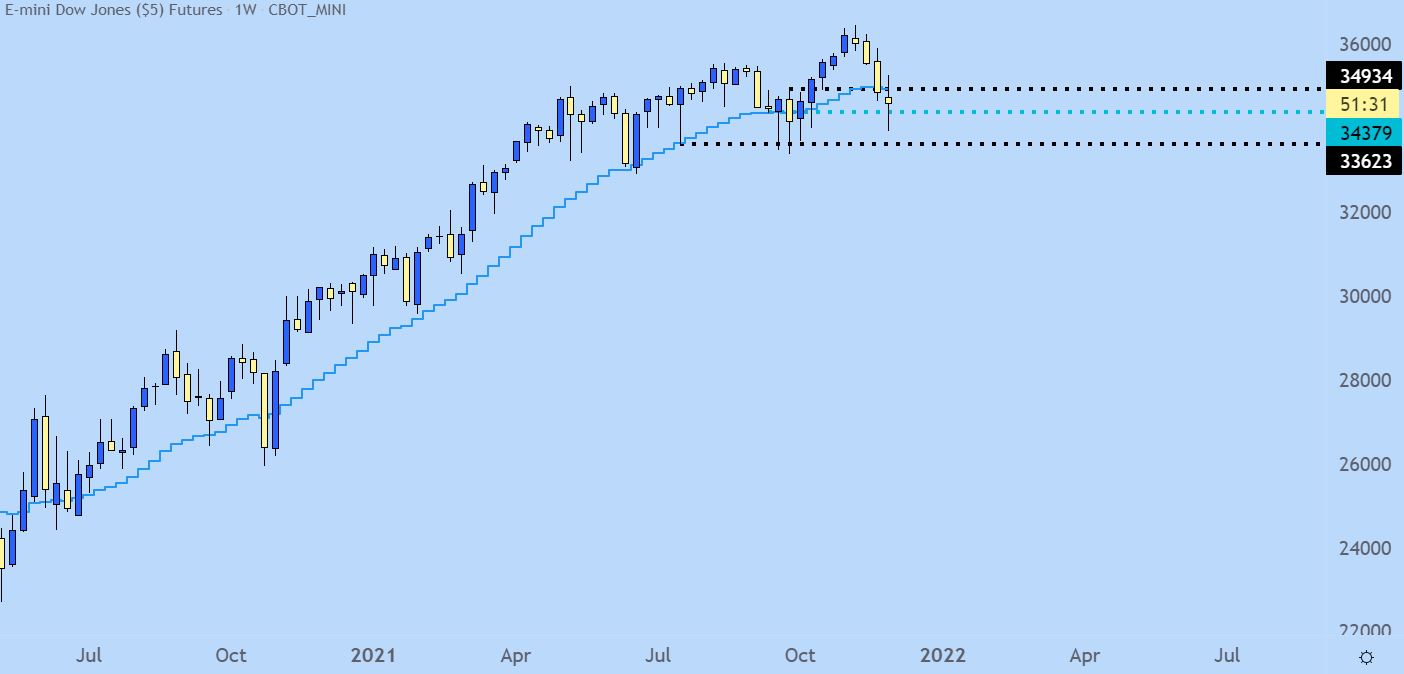
Chart prepared by James Stanley; Dow Jones on Tradingview
--- Written by James Stanley, Senior Strategist for DailyFX.com
Contact and follow James on Twitter: @JStanleyFX


