S&P 500, Apple Talking Points
- It’s been a busy past week after the Omicron variant came into the equation, with the FOMC and Jerome Powell taking a surprisingly hawkish tone at this weeks Humphrey Hawkins testimony.
- Yesterday saw a large move-lower on news that Omicron has landed in the U.S., but there’s still much that we don’t yet know about this new strain of Covid. The Fed stance, however, may be unsettling to markets at the moment given the stark contrast to how they’ve talked about inflation so far this year.
- The analysis contained in article relies on price action and chart formations. To learn more about price action or chart patterns, check out our DailyFX Education section.


It was last Thursday that news began to spread of the Omicron variant. This led to a splash in U.S. markets on Friday when trading opened after the holiday. And to be sure, there was a bit of pressure that had started to show ahead of that news, as U.S. monetary policy was looking more and more like it might be tilted in a hawkish direction in the not-too-distant future.
Janet Yellen had some comments on the matter just last week, remarking that the Fed needed to make a shift before inflation became ‘endemic.’ At the time, this flew in the face of everything we’d heard from the Fed, who had continued to talk up the ‘transitory’ narrative despite the fact that inflation had only continued to grow throughout the year while the bank remained loose and passive.
Following that Friday splash in stocks, a bit of stability had started to show on Monday and that even held into Tuesday. But that’s the point that another bearish driver came into the equation when Powell started to take on a hawkish tone on the first day of his twice-a-year Humphrey Hawkins testimony in-front of Congress.
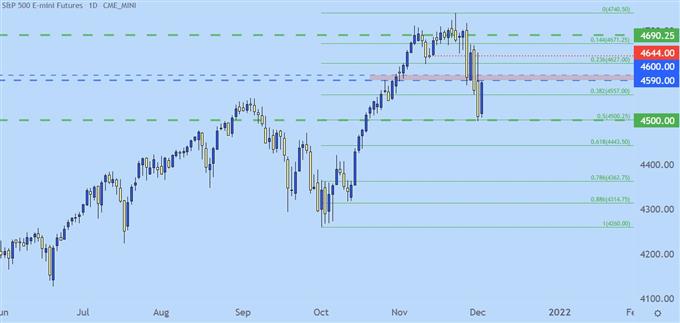
This wasn’t received well at all by equity markets with the S&P 500 putting in a bearish engulf formation on the Daily. That started to show some bounce yesterday and then another shoe dropped, with confirmation of the Omicron variant in the U.S. after a case was reported in California. This morning another two cases were found in Minnesota, one of which was from a person that had recently traveled to NYC.
So far this morning stocks are holding up fairly well. But, there does appear to have been a sentiment shift this week and today’s bounce may be a corrective move in what’s building in to be a more bearish near-term picture.
Today’s bounce is coming at a big level of 4500 in the S&P 500. This is both a psychological level and a 50% marker from a Fibonacci retracement around the most recent major move. That price actually traded at the close yesterday and, so far, it’s held as near-term support. But, there’s now some fairly significant resistance sitting overhead, around that same spot of prior support around the 4590-4600 area on the chart.
S&P 500 Daily Price Chart

Chart prepared by James Stanley; S&P 500 on Tradingview
S&P 500 Shorter-Term
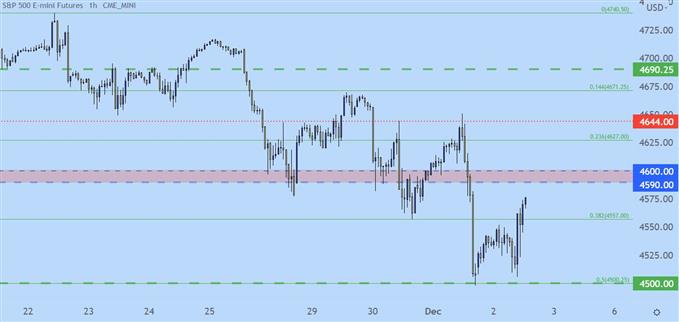
As noted above, this seems like a corrective move after the earlier-week push down to fresh lows. Tomorrow brings Non-farm Payrolls and this can certainly shift the matter. Should numbers come out weak, there’s a case to be made for even more equity strength as the Fed wouldn’t be facing quite as much pressure. But, this may not emanate directly from the headline number, as the inflation theme remains of importance and if Average Hourly Earnings print below the 5% annualized figure, there could be more motive in the bullish push higher.
The levels to follow: prior support is now resistance from 4590-4600. Beyond that, 4625/4627 remains of interest and after that, 4644, which has already shown a couple of solid resistance hits so far this week.
On the support side of the matter, a fall back-below the 4500 level exposes the index to further losses, with the next significant support showing around 50 handles lower.
S&P 500 Hourly Price Chart

Chart prepared by James Stanley; S&P 500 on Tradingview
10 Year Rates
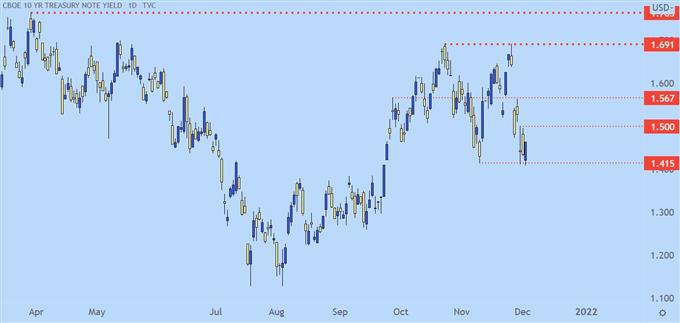
A major focal point at the moment remains rates, with the 10 year spilling lower this week even after Powell’s comments. This highlights what the market is really concerned about, and that appears to be weakness on the back of the Omicron variant as yields dipped last week and still haven’t really recovered.
I think this is one of the most important charts in the world at the moment, and if the 10 year falls below support at the 1.415% mark, this could be a negative sign for sentiment that could bring more weakness into stocks.
Ten Year Treasury Yields

Chart prepared by James Stanley; TNX on Tradingview
Apple
There’s an interesting theme to follow here, particularly for equity bulls.
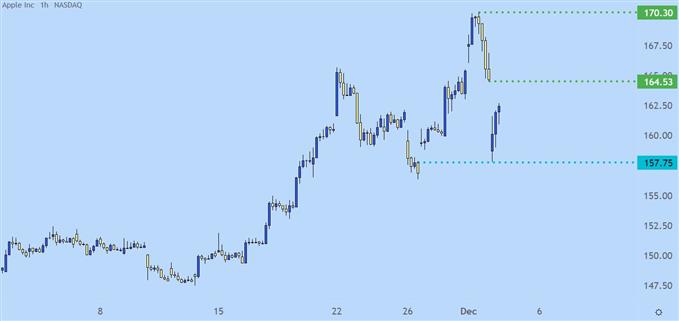
Apple had a relatively slow year up until a few weeks ago. At the time, Microsoft had just surpassed Apple in market cap, and Apple was trading at a P/E ratio around 24, which, at this point, has the appearance of a value stock.
But when Apple was at resistance, around the 157 mark, the company released a PR announcement about the electric, autonomous vehicle that they’re working on, announcing that they think it will be ready in 2025.
Just like that the stock snapped higher and didn’t really stop gaining until this week, tagging the 170 handle yesterday before the omicron fears drove prices lower. This morning was marked with a massive gap-down to inside of the 158 handle. A chunk of that loss has already been clawed back but there still remains quite a bit of gap to work with here, and this could remain attractive for those looking at the long side of U.S. stocks.
Apple Hourly Price Chart

Chart prepared by James Stanley; AAPL on Tradingview
--- Written by James Stanley, Senior Strategist for DailyFX.com
Contact and follow James on Twitter: @JStanleyFX


