


Nasdaq 100, Dow Jones, S&P 500, Technical Analysis – Week Ahead
- Nasdaq 100 may be forming Head & Shoulders, watch for confirmation
- Dow Jones remains in a near-term downtrend, eyes on moving averages
- S&P 500 in a consolidative state, but broader uptrend still remains intact

Nasdaq 100 Technical Analysis
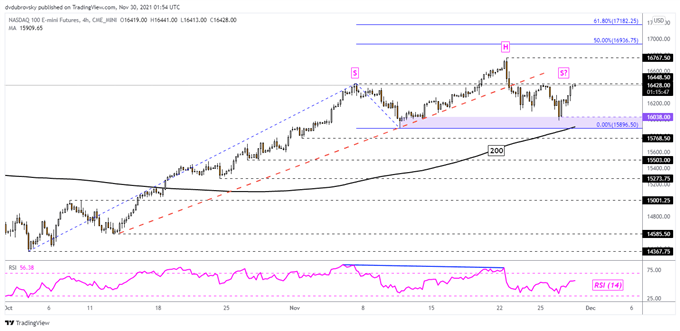
Following a volatile week, Nasdaq 100 futures are attempting to regain upside momentum. It should be noted that leading into the recent turn lower, negative RSI divergence was present. The 4-hour chart reveals what could be a bearish Head & Shoulders that is brewing. Prices have established a key zone of support between 15896 and 16038, attempting to breach what appears to be the right shoulder around 16448.
Climbing above this price towards the all-time high at 16767 could invalidate the chart formation, opening the door for the Nasdaq to resume the dominant uptrend. That would expose the 50% and 61.8% Fibonacci extension levels at 16936 and 17182 respectively. In the event prices turn lower, keep a close eye on the 200-period Simple Moving Average (SMA). The latter may reinstate the dominant uptrend.
Dow Jones Technical Analysis
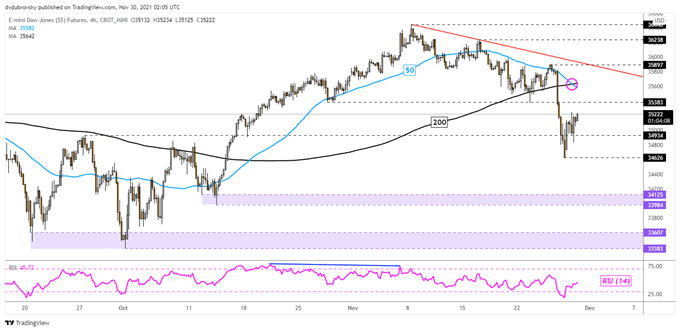
Dow Jones futures remain in a near-term downtrend since the beginning of November, amplified by volatility over the Thanksgiving holiday. During that period, prices confirmed a breakout under the 200-period SMA, opening the door to a broader reversal. Recently, a bearish crossover between the 200 and 50-period lines has formed, indicating a downward technical bias.
Still, prices have turned higher after leaving behind support at 34626. The Dow seems to be facing the 35383 inflection point for further upside potential. But, the 50-period SMA could reinstate itself as resistance, pivoting the index lower. Closing back under 34626 exposes lows from early October on the chart below. Otherwise, clearing the SMAs may open the door to revisit the November peak at 36446.
Introduction to Technical Analysis
Learn Technical Analysis
Recommended by Daniel Dubrovsky
S&P 500 Technical Analysis
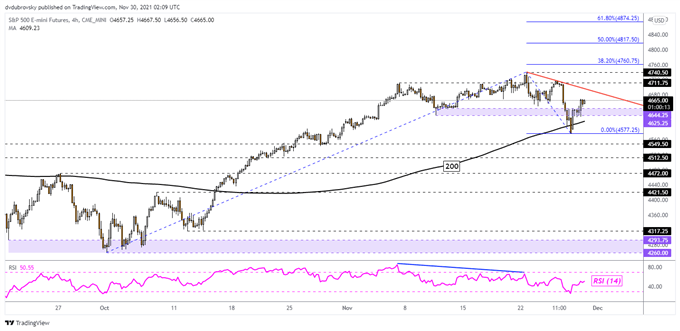
S&P 500 futures have remained in a broadly consolidative state since early November. Last week’s volatility resulted in prices piercing the key 4625 – 4644 support zone. However, the 200-period SMA established itself as another support level, pivoting prices back above the aforementioned range. This leaves the S&P 500 facing what could be a potential near-term falling trendline from November 22nd.
The line could pivot prices lower, creating a zone of consolidation between the trendline and the 200-period SMA. Climbing above the trendline exposes the all-time high at 4740. Resuming the uptrend exposes the 38.2% Fibonacci extension at 4760. Otherwise, taking out key support at 4577 may open the door to revisiting levels from late October on the 4-hour chart below.

--- Written by Daniel Dubrovsky, Strategist for DailyFX.com
To contact Daniel, use the comments section below or @ddubrovskyFX on Twitter
Trade Smarter - Sign up for the DailyFX Newsletter
Receive timely and compelling market commentary from the DailyFX team


