


Australian Dollar, AUD/USD, AUD/CAD, EUR/AUD – Technical Outlook
- Australian Dollar facing mixed signals vs. USD, CAD and EUR
- AUD/USD may reverse higher on support, AUD/CAD ranging
- EUR/AUD downtrend remains despite recent consolidation

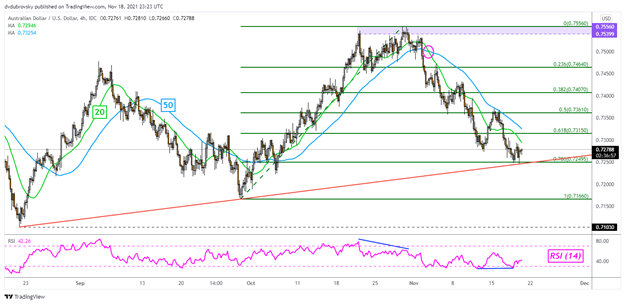
AUD/USD 4-Hour Chart
The Australian Dollar faces its next potential opportunity to reverse the near-term downtrend against the US Dollar since the beginning of this month. AUD/USD is facing a combination of a rising trendline from August and the 78.6% Fibonacci retracement level at 0.7249. This is making for a critical area of support as positive RSI divergence shows that downside momentum is fading.
The latter can at times hint at a turn higher. Still, the 20- and 50-period Simple Moving Averages (SMA) remain downward-sloping. This follows a bearish ‘Death Cross’ from earlier this month. Clearing these lines could be a signal that the Aussie is ready to mount a recovery against the Greenback. Otherwise, clearing immediate support exposes the September low at 0.71660 towards the August low at 0.7103.
| Change in | Longs | Shorts | OI |
| Daily | 2% | 3% | 2% |
| Weekly | 29% | -46% | 0% |
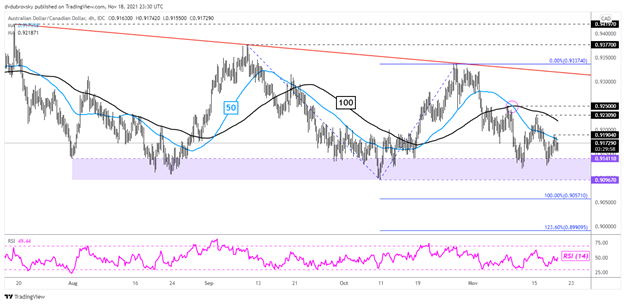
AUD/CAD 4-Hour Chart
The Australian Dollar continues to trade within the boundaries of a Descending Triangle against the Canadian Dollar. As such, AUD/CAD could remain in a consolidative state, with a slight downward bias, until a breakout is achieved. For now, the pair has recently tested the upper bound of the triangle floor, which seems to be a range between 0.9096 and 0.9141.
The 50- and 100-period SMAs seem to be offering a downward bias, with a ‘Death Cross’ having been established earlier this month. Clearing the 50-period line and 0.9190 could be a signal that prices may turn higher towards the ceiling of the triangle. Otherwise, diving deeper into the floor of the triangle will bring the pair closer to a breakout and the 100% Fibonacci extension at 0.9057.
Trade Smarter - Sign up for the DailyFX Newsletter
Receive timely and compelling market commentary from the DailyFX team
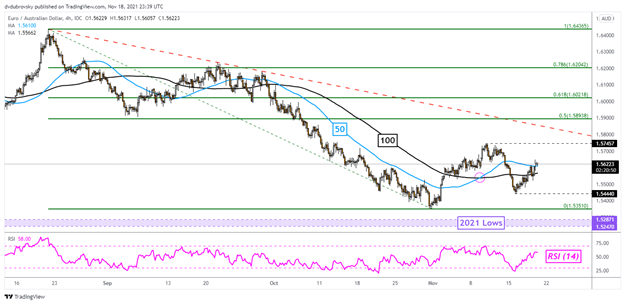
EUR/AUD 4-Hour Chart
All things considered, the Australian Dollar remains on the offensive against the Euro since August. This is despite recent consolidation in EUR/AUD. The broader downtrend still remains intact, especially with a falling trendline from late August maintaining the downside focus. Still, a bullish ‘Golden Cross’ remains in play from earlier this month between the 50- and 100-period SMAs.
Immediate resistance seems to be 1.5745, where clearing the point would expose the trendline highlighted earlier. On the flip side, immediate support seems to be at 1.5444. Breaking under the latter may open the door to retesting the October low at 1.5351. Just under the latter sits the 1.5247 – 1.5287 support zone. These are current 2021 lows set earlier this year.
--- Written by Daniel Dubrovsky, Strategist for DailyFX.com
To contact Daniel, use the comments section below or @ddubrovskyFX on Twitter


