


US Dollar, USD/SGD, USD/THB, USD/IDR, USD/PHP – ASEAN Technical Analysis
- US Dollar losing ground to most ASEAN currencies lately
- USD/SGD continues to consolidate, USD/THB clears trendline
- USD/IDR channel breakout falters, USD/PHP facing key support

Singapore Dollar Technical Outlook
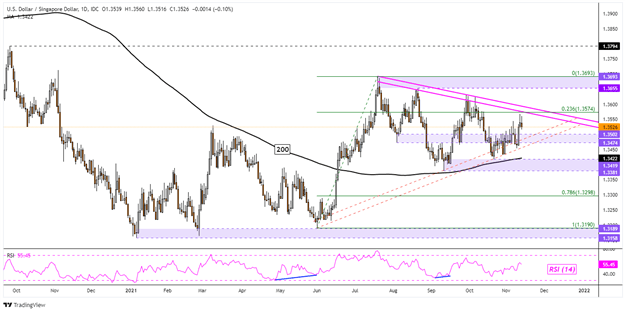
The US Dollar has been extending gains against the Singapore Dollar since USD/SGD tested the 1.3381 – 1.3419 support zone. Granted, upward progress has been very slow and the pair remains mostly range-bound since March. Prices are oscillating between a rising and falling trendline from June and July respectively. The direction of the breakout could hint at the next lasting trend. Until then, prices may remain in a neutral setting.
USD/SGD Daily Chart
Thai Baht Technical Outlook
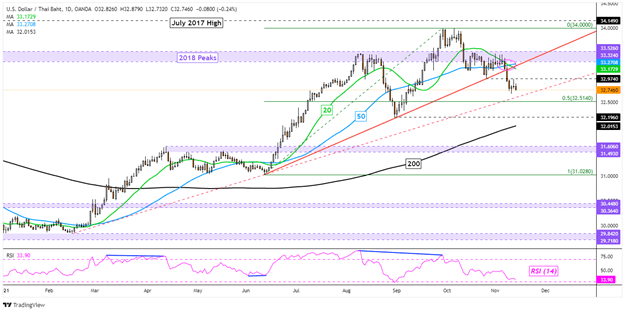
The US Dollar is losing ground to the Thai Baht, with USD/THB in a downtrend since October. Prices are quickly approaching a potential rising trendline from February. This comes after taking out rising support from June and a bearish Death Cross between the 20- and 50-day Simple Moving Averages (SMAs). Rising support from February could maintain the dominant uptrend, pivoting prices higher. Otherwise, clearing it may open the door to extending recent losses. Such an outcome could soon place the focus on a 200-day SMA. A turn higher may see the 20- and 50-day SMAs hold as resistance.

USD/THB Daily Chart
Indonesian Rupiah Technical Outlook
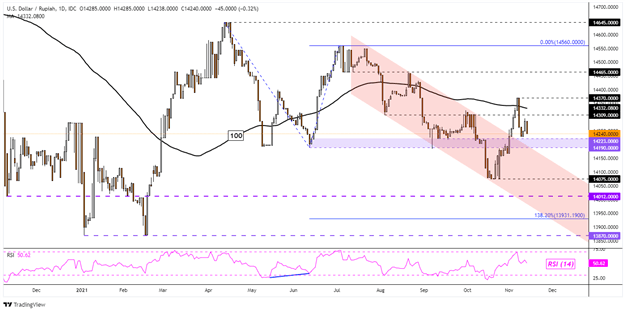
The US Dollar’s breakout against the Indonesian Rupiah has recently broken down. USD/IDR popped above a Descending Channel from July in late October. After testing the 100-day SMA, the pair pivoted lower towards the 14223 – 14190 inflection zone. Despite this, prices remain in a near-term uptrend since October. Taking out the inflection range may see the pair extend losses back towards 14075. Otherwise, bouncing may open the door to retest 14370 towards August peaks.
USD/IDR Daily Chart
Philippine Peso Technical Outlook
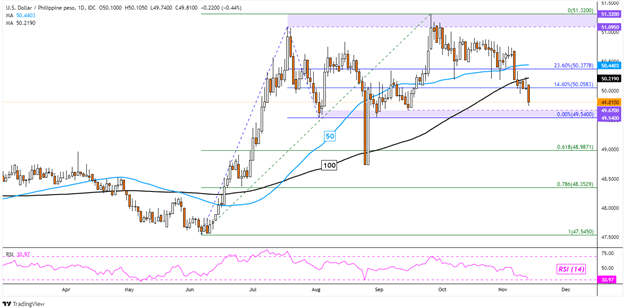
The US Dollar has also been losing ground against the Philippine Peso, with USD/PHP now below both the 50- and 100-day SMAs. This is leaving the pair facing the 49.54 – 49.67 support zone. A lack of positive RSI divergence shows that momentum is favoring the near-term downtrend. Breaking under the range exposes the 61.8% Fibonacci retracement at 48.9871. Otherwise, a bounce off support may see prices pivot higher towards the SMAs to find new resistance.
USD/PHP Daily Chart
--- Written by Daniel Dubrovsky, Strategist for DailyFX.com
To contact Daniel, use the comments section below or @ddubrovskyFX on Twitter
Trade Smarter - Sign up for the DailyFX Newsletter
Receive timely and compelling market commentary from the DailyFX team


