


Gold talking points:
- Gold prices remain in a pattern of longer-term digestion and this may remain until 1834 (resistance) or 1680 (support) are finally taken-out.
- Gold has been sensitive to higher rate themes in the US with gold prices topping out last August as US rates bottomed. With the appearance of a rising wedge within the longer-term digestion, will the Fed take a hawkish tilt that can propel gold prices lower?
- The analysis contained in article relies on price action and chart formations. To learn more about price action or chart patterns, check out our DailyFX Education section.

Tomorrow brings an FOMC meeting where there’s legitimate expectations for an announcement of policy change. There hasn’t been much of this so far in 2021 as the bank has largely been in wait-and-see mode after triggering a plethora of stimulus last year that’s remained online since. But, we’re finally at the stage where the Fed feels that it’s appropriate to begin paring back that stimulus outlay by starting to taper bond purchases.
The Fed has had a major impact on gold. When the pandemic was getting priced-in last March, gold prices fell by almost 15% before finally grasping on to support, and once relative calm returned after a massive number of liquidity programs were triggered, gold prices started to jump again with stock prices coming back to life.
Gold prices ran all the way into early-August, at which point gold punched up to a fresh all-time-high at $2,075. After setting a bearish engulfing candlestick that day, gold started to pull back and hasn’t really stopped. That top in gold coincides with US rates bottoming and as Treasury yields have continued to increase, gold prices have continued to struggle.
The longer-term chart does still show a bull flag formation with a hold around the 38.2% Fibonacci retracement of the recent major move, which coincides with the Fed moving from a hiking stance into a cutting cycle in late-2018 and early-2019.
Gold Weekly Price Chart

Chart prepared by James Stanley; Gold on Tradingview
Gold on a shorter-term basis begins to get a bit messier, but there is some context to work with. From the daily chart below, we can see an area that’s been fairly sticky for support, and that’s around the 1680 level that was tested twice in March of this year. As a matter of fact, that was a double bottom formation that filled-in quite nicely shortly after the Q2 open.
But early-Q2 was also when rates were receding from the Q1 spike. And when the Fed showed little interest in hiking rates, there was more reason for rates to slack and that continued to push the topside of gold into early-June, at which point the psychological level of 1900 came back into the equation and gold prices weren’t able to make much ground beyond that level. After price action grinded there for a few weeks bears finally prevailed and pushed back down to the 1750 level before the July open.
Collectively, when this sticky zone of support is combined with the series of lower-highs that have printed since last year’s top, and there’s a descending triangle formation that’s starting to show with horizontal support being paired up with lower-high resistance.
Gold Daily Price Chart
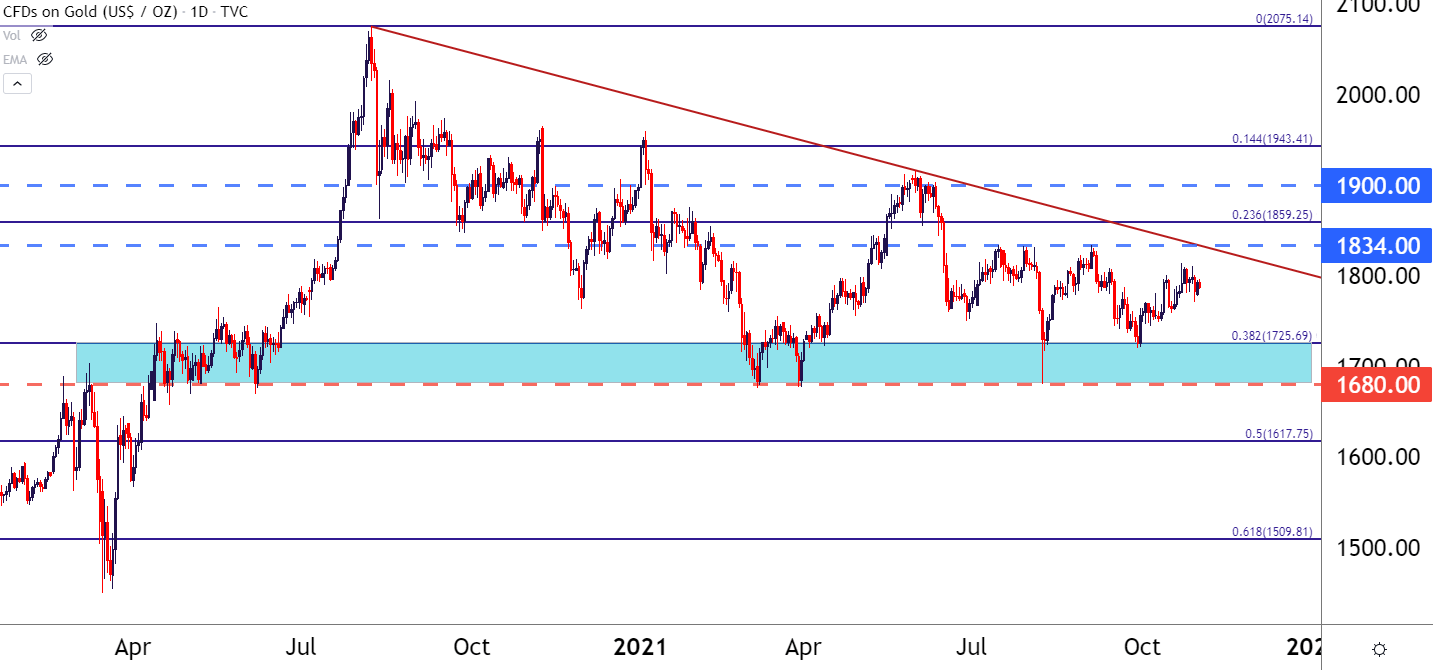
Chart prepared by James Stanley; Gold on Tradingview
Gold Strategy
From a longer-term basis the approach can become a bit more clear: A breach of 1680 support or 1834 resistance can open the door for trending scenarios. Until then, however, gold prices are prone to more noise and shakiness in near-term setups.
There could be some workable context there, but this must be taken with the above in mind. But last Friday I highlighted a short-term rising wedge pattern developing which will often be approached with the aim of bearish reversals. Friday saw prices begin to breach below the formation, and yesterday saw a pullback to resistance on the underside of this formation.
This can keep the door open for short-term bearish scenarios in gold ahead of FOMC, and if the Fed does take a hawkish twist at tomorrow’s rate decision, the fundamental backdrop could further push the trend potential being highlighted by this technical formation.
Gold Four-Hour Price Chart
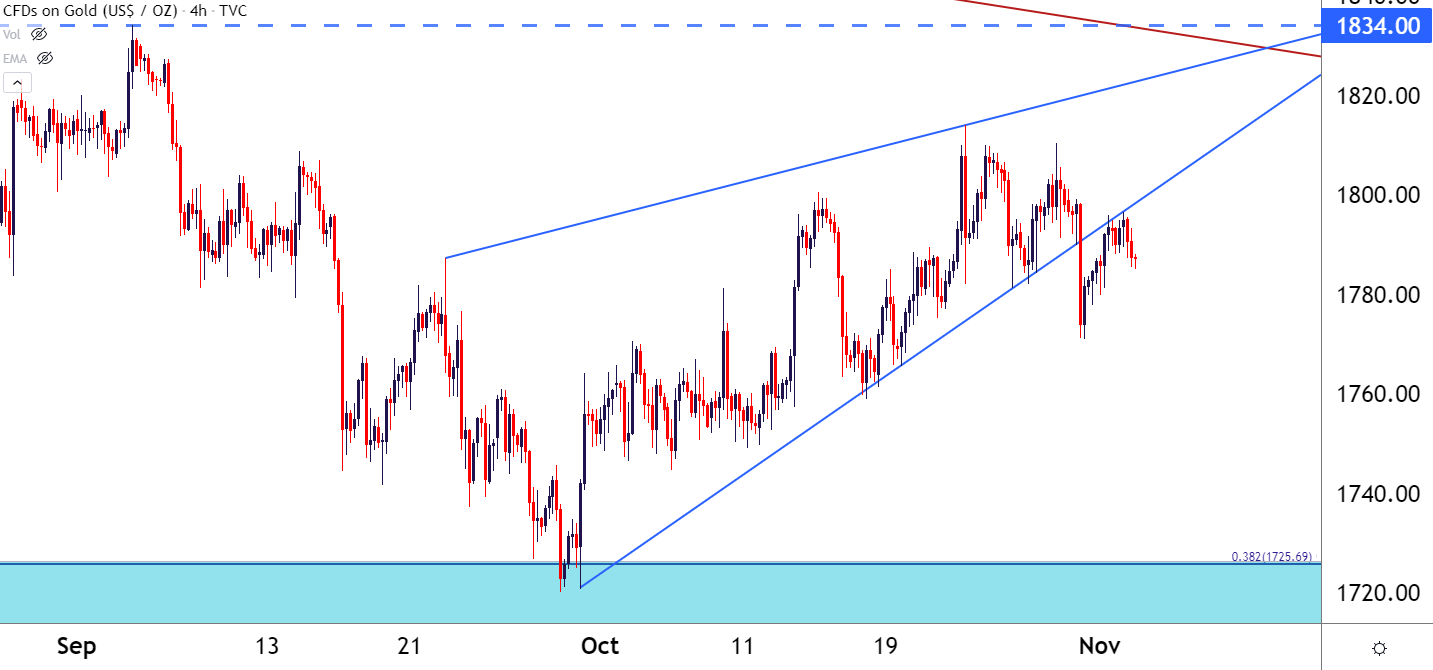
Chart prepared by James Stanley; Gold on Tradingview
--- Written by James Stanley, Senior Strategist for DailyFX.com
Contact and follow James on Twitter: @JStanleyFX


