


Australian Dollar, AUD/USD, EUR/AUD, AUD/CAD- Talking Points
- AUD/USD has run hard to the topside but has some mixed signals
- The Australian Dollar appears more range bound against EUR and CAD
- AUD momentum might be waning. Can it pick up steam again?
Introduction to Technical Analysis
Technical Analysis Tools
Recommended by Daniel McCarthy
AUD/USD TECHNICAL ANALYSIS
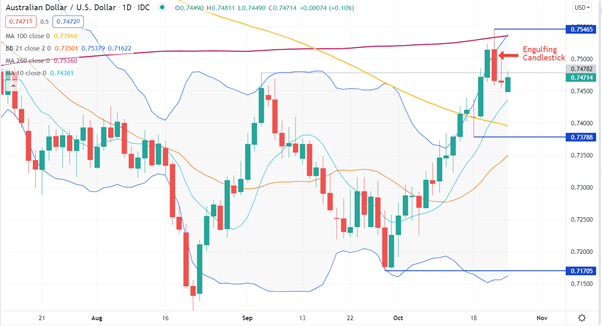
After a consistent rally off the 0.71705 low, the Australian Dollar has some conflicting technical signals emerging.
When the 10-day simple moving average (SMA) crossed above the 100-day SMA it made a Golden Cross, which could indicate bullish momentum.
At the same time that these moving averages crossed, a bearish Engulfing candlestick pattern is observed. This can potentially signal a trend reversal. The pattern is seen when the candle of a day ‘engulfs’ the entire body of the candle of the previous day.
The price recently moved above the upper band of the 21-day SMA-based Bollinger Band and had a close outside of it. Then it had a close back inside the band, which could bolster the case for a bearish turn.
The 260-day SMA was pierced to the topside but was unable to close above there. This failure may indicate a pause or turn in momentum. Its current level of 0.75360 and the previous high of 0.75465 may offer resistance.
Below the market, the previous lows of 0.73788 and 0.71705 are possible support levels.
EUR/AUD TECHNICAL ANALYSIS
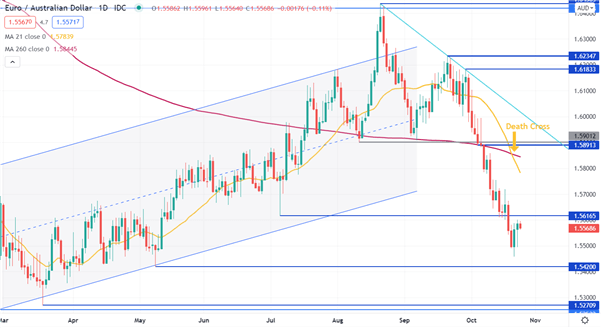
EUR/AUD has moved lower in recent weeks as several support levels have been broken, and these may now offer resistance as pivot points at 1.56165 and 1.58913. Previous highs at 1.61833, 1.62347 and 1.64365 are also potential resistance levels.
The 21-day SMA crossed below the 260-day SMA to form a Death Cross which might indicate bearish momentum.
On the downside, previous lows at 1.54200, 1.52709 and 1.52532 might provide support.

AUD/CAD TECHNICAL ANALYSIS
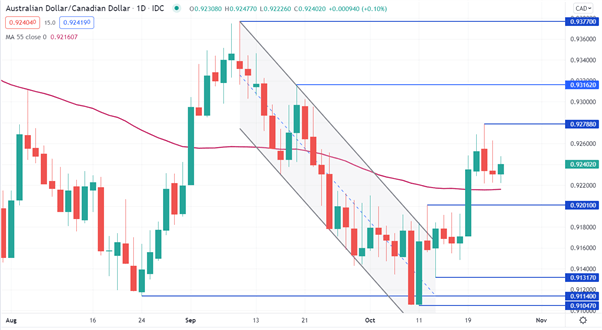
AUD/CAD appears to be in range-trading mode after trying to break lower earlier in the month. The previous low that was broken at 0.91140 is now a pivot point that might provide support.
The new low put in place at 0.91047, another prior low at 0.91317 and the 55-day SMA currently at 0.921607 are possible support levels.
On the topside, the prior highs at 0.92788, 0.93162 and 0.93770 could offer resistance.
--- Written by Daniel McCarthy, Strategist for DailyFX.com
To contact Daniel, use the comments section below or @DanMcCathyFX on Twitter


