


New Zealand Dollar, NZD/USD, NZD/JPY, NZD/CAD - Talking Points
- NZD/USD retreats from highs, markets are watching momentum
- Pullbacks see NZD/JPY and NZD/CAD in the crossfire of their ranges
- The New Zealand Dollar has weakened of late. Will losses accelerate?

NZD/USD TECHNICAL ANALYSIS
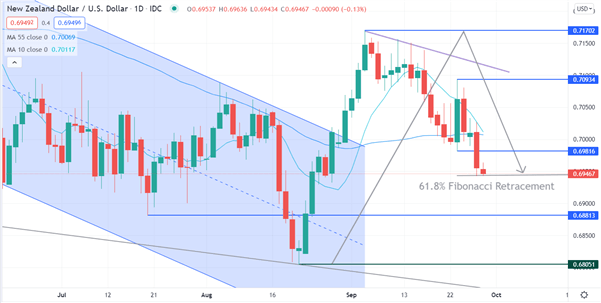
NZD/USD initially broke up through a descending channel to a high of 0.71702 from a low of 0.68051. The current price is close to the 61.8% Fibonacci Retracement level of that move at 0.69445. This level may initially provide support, but a conclusive move below that level could be bearish.
The 10-day simple moving average (SMA) has developed a steep descending gradient with this retracement and is close to crossing the 55-day SMA. If it does cross over, that would form a Death Cross, which might indicate bearish momentum.
If NZD/USD does move lower, there is possible support at the pivot point of 0.68813 and potentially at the previous low of 0.68051. Resistance seems to be at the previous highs of 0.70934 and 0.71702.
NZD/JPY TECHNICAL ANALYSIS
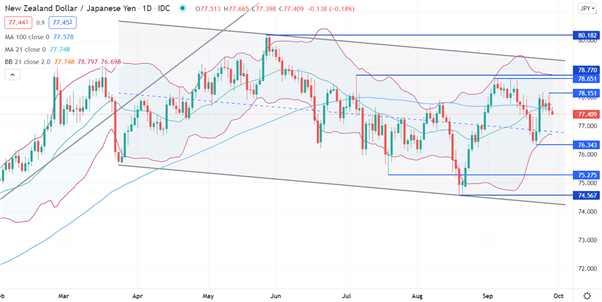
NZD/JPY is currently in an overall slightly descending channel and has gyrated between the floor and ceiling of the channel a number of times. Volatility has recently calmed down, as measured by the width of the 21-day SMA based Bollinger Bands, as the price has moved back in the range.
The 10-day SMA has moved below the 100-day line, while the 21-day SMA remains above the 100-day. With the short-term SMAs on either side of the 100-day line, it raises the possibility that short-term market momentum is conflicted and could be caught in a range.
Topside resistance might be offered at the previous highs of 78.151, 78.651 and 78.77. On the downside, potential support may be at the previous low of 76.343, a pivot point at 75.275 or the low of 74.567.

NZD/CAD TECHNICAL ANALYSIS
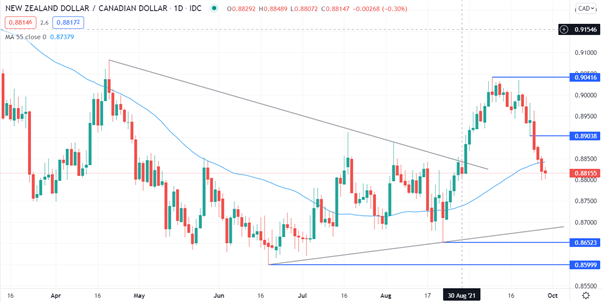
After NZD/CAD broke up through a descending trend line resistance, it made a high 0.90416 from a low of 0.85999. Since then it has moved down through the 55-day SMA and the next possible support might be provided at the 61.8% Fibonacci Retracement level of 0.87686.
Below that, the previous lows of 0.86523 and 0.85999 may provide support. Above the current price, the 55-day SMA of 0.88415 and the previous highs of 0.89038 and 0.90416.
--- Written by Daniel McCarthy, Strategist for DailyFX.com
To contact Daniel, use the comments section below or @DanMcCathyFX on Twitter


