


Norwegian Krone, EUR/NOK, USD/NOK - Talking Points
- The Norwegian Krone has softened against Euro and US Dollar of late
- While EUR/NOK and USD/NOK have similar setups, there are differences
- Will the NOK continue to weaken or has the trend ended?

EUR/NOK TECHNICAL ANALYSIS
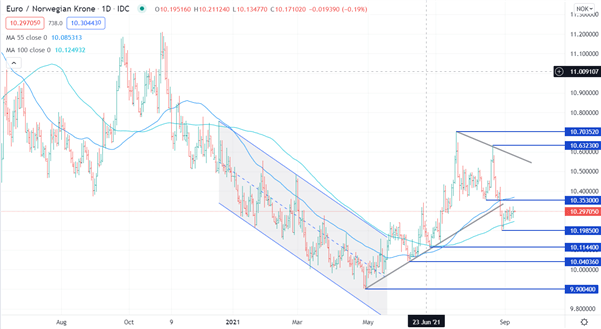
After establishing a low for the year at 9.900 in April, EUR/NOK began a rising trend. While the ascending trendline was broken at the end of August, there is still some upward momentum. This is indicated by the 55-day and the 100-day Simple Moving Averages (SMA) maintaining a positive gradient.
Historically, the EUR/NOK does not tend to trade between the 55-day SMA and the 100-day SMA for extended periods. It should be noted here that past performance is not indicative of future results. A break above the 55-day SMA, currently at 10.368, may indicate a resumption of the uptrend. A break below the 100-day SMA, presently at 10.244, might show a return to range trading.
On the topside, there may be some resistance at the break-down pivot point of 10.353 and then further higher at the descending trendline resistance of 10.570. Additional resistance could be seen at the most recent previous highs of 10.632 and 10.703 respectively.
To the downside, some support might be provided at previous lows of 10.198, 10.114, 10.040 and 9.900.
EUR/NOK CHART

USD/NOK TECHNICAL ANALYSIS
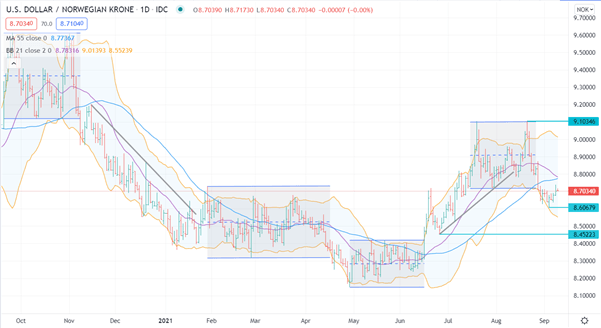
Like many currency pairs, USD/NOK has had a tendency over the last year to alternate between periods of range-trading blocks and trend-following patterns. The recent move lower appears to have broken through the lower bound of a range-trading block.
When the USD/NOK broke lower out of the range-trading block, it also touched the lower bound of the 21-day SMA, 2 standard deviation Bollinger Band. It has since moved back inside the band and this may be a signal that USD/NOK is returning to a range-trading environment.
A signal to watch for a possible beginning of a downtrend would be the 21-day SMA crossing over the 55-day SMA to form a Death Cross. The 21-day SMA is currently at 8.783 and the 55-day SMA is at 8.773.
To the downside, some support may be provided at the previous lows of 8.606 and at 8.452. Above the market, some resistance might be seen at the 21- day and 55-day SMAs currently at 8.783 and at 8.773 respectively.
--- Written by Daniel McCarthy, Strategist for DailyFX.com
To contact Daniel, use the comments section below or @DanMcCathyFX on Twitter


