


US Dollar Talking Points:
- The US Dollar put in a strong move to start the day, rushing back up to resistance.
- This is an update to the Analyst Pick published on Friday, looking at setups around the USD.
- With the next major drivers expected to be Jackson Hole and then the September FOMC, ranges may remain near-term and below, I look at a couple of different ways to approach the USD with that backdrop in mind.
- With the start of Q3, fresh quarterly forecasts have been published from DailyFX. To access the USD forecast, the link below will get that set up:

We’re now in the second half and third quarter of this year and the first six months left little to be desired in the realms of volatility. Coming into the year, few would expect that companies like Gamestop or AMC or Bed Bath and Beyond would take over the headlines; but here we are. Perhaps more surprising, meme coins, such as Dogecoin, made a massive splash in the crypto sphere and there appears to be quite a bit left unsettled around those matters.
In the FX world, the US Dollar has, for the most part, put in a range formation. To be sure, the currency was clinging to a consistent downtrend when the year began. But prices were already at a massive level of support when the door opened to 2021 and that support ended up playing out in Q1, with a strong topside rally in the month of March.
The first two months of Q2 saw sellers return with gusto, as a clean and consistent sell-off drove the currency right back down to that big support zone, straddling the 90-handle on the chart. But, again, bears were unable to breakthrough and this left the currency holding above support ahead of the June FOMC rate decision.
The June FOMC rate decision is when the US Dollar popped with aggression, breaking out to a fresh monthly high. That led into a pullback for higher-low support, which was similarly met with a bullish response and prices broke out again, setting another fresh two-month-high just before last week’s NFP release.

US Dollar Daily Price Chart

Chart prepared by James Stanley; USD, DXY on Tradingview
US Dollar Shorter-Term
The US Dollar put in a strong move ahead of last week’s NFP release, setting a fresh two-month-high just before the data came out. And while the headline number printed above expectations, there was also an unexpected jump in the unemployment rate and this really speaks to the Fed’s recent focus of late.
Even with inflation running above both the Fed’s targets and their forecasts, they’ve continued to say that its transitory and, instead, have put the predominant amount of their focus on the employment mandate. And with this unexpected jump in the unemployment rate, we’re even further away from the ‘full employment’ that the Fed is looking for and this could give the bank even more time to stay on uber loose monetary policy.
That NFP release helped the US Dollar to soften and that pullback continued over the July 4th holiday, with prices drifting down to the 92 handle on DXY. But, as US markets came back online so did the theme of USD strength with the Greenback rushing right back up to near-term resistance.
US Dollar Two-Hour Price Chart
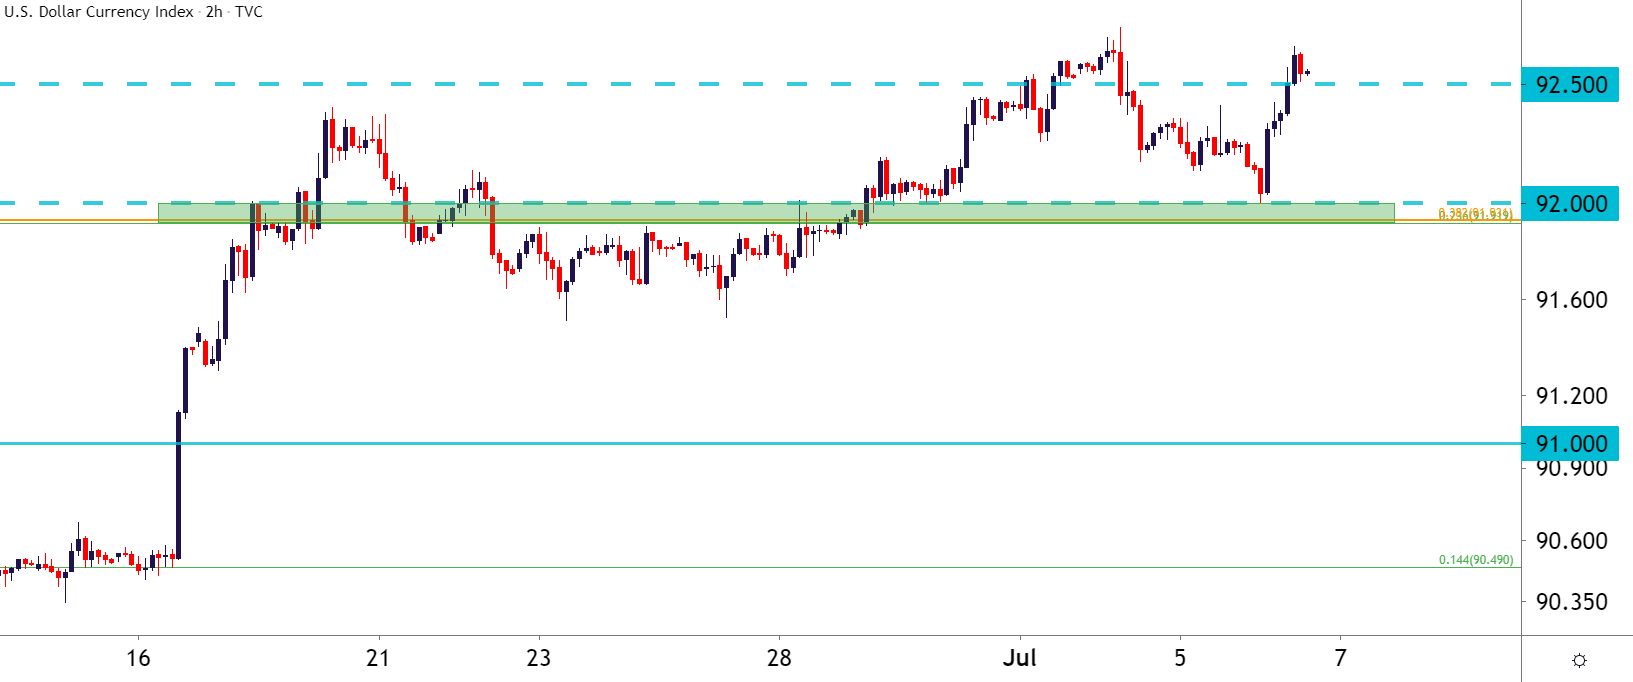
Chart prepared by James Stanley; USD, DXY on Tradingview
Compatible Setups on Either Side of the USD
I had looked into a series of setups after last week’s NFP report and today, I’m going to dial that in on setups that could be compatible for either side of the US Dollar. As in, for those that are looking for the USD to continue-higher, testing that March swing high, I’m looking at EUR/USD below. Or, for those that are looking to fade this strength positing that the USD will stick inside of that Friday inflection point, I look at NZD/USD below.
EUR/USD
EUR/USD set a fresh two-month-low this morning and that, combined with the 1.1700 support zone lurking below, helps to keep this pair as one of the more attractive venues for a continuation of USD-strength.
It was only a couple of weeks ago that the 1.1965-1.2000 zone was back into play, but sellers made fast work of that around the FOMC rate decision and price action hasn’t really looked back since. When I looked at the pair again last Friday, I highlighted a lower resistance zone around the 1.1900 handle that came into play this morning before bears re-appeared.

EUR/USD Two-Hour Price Chart
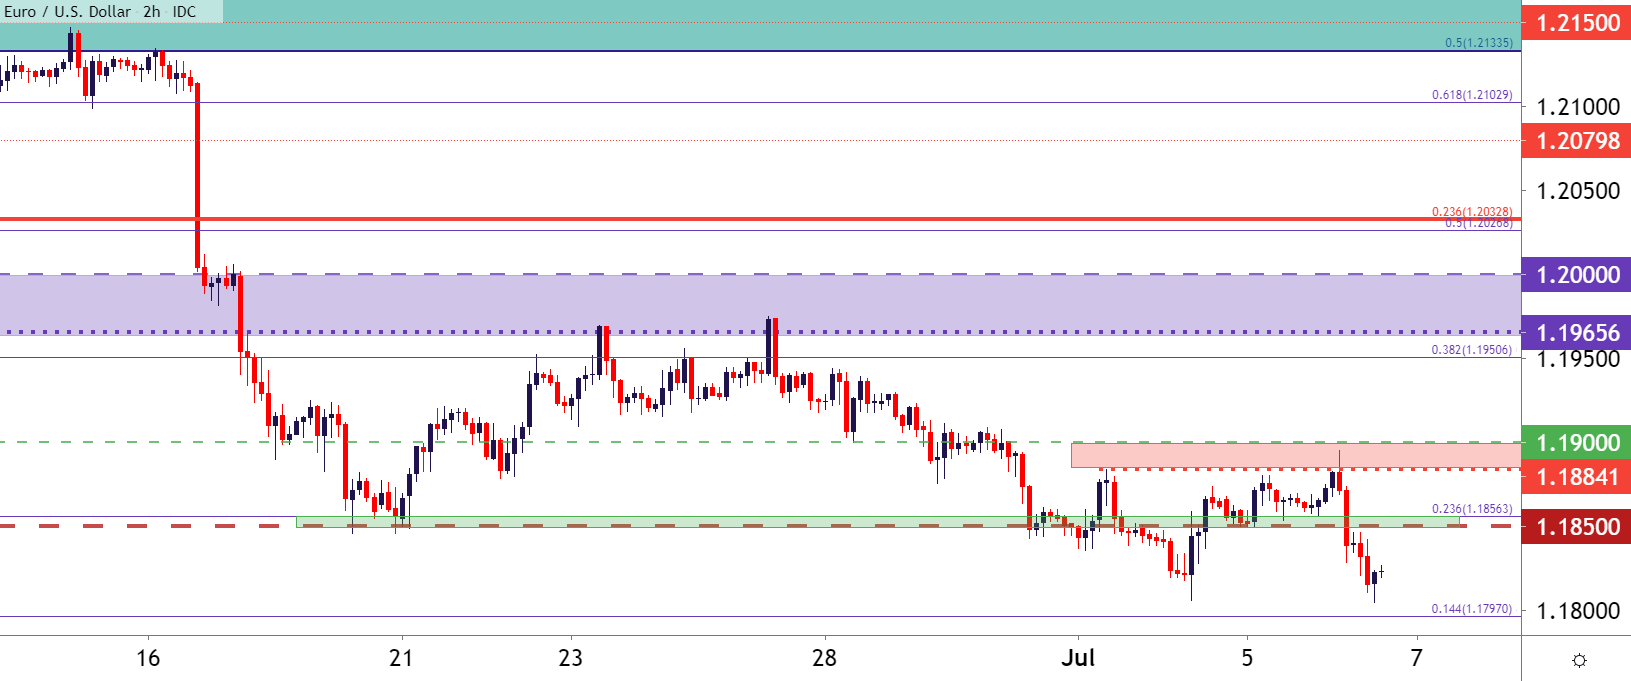
Chart prepared by James Stanley; EURUSD on Tradingview
It’s the longer-term chart that’s compelling here, as the 2021 low sits in a zone of support around the 1.1700 handle; and this mirrors that USD chart above quite well. The daily chart also highlights a similar range so far in 2021 trade which is, again, very similar to the US Dollar backdrop investigated earlier.
And on a near-term basis, while EUR/USD did push down to a fresh low this morning, many other major pairs did not; and this highlights the additional weakness that could be provided to the pair from the Euro, to go along with USD-strength if that scenario does come about.
EUR/USD Daily Price Chart

Chart prepared by James Stanley; EURUSD on Tradingview
NZD/USD
Given the broad-based strength that’s been on display since FOMC, it’s not easy to find an attractive venue to fade that theme. But, with some deduction, we can at least begin to line up some possible candidates for such a scenario, and with that I’m looking at NZD/USD.
What makes NZD/USD so special? A build of higher-lows. While many other majors continued to run in the aftermath of the FOMC, the low point for NZD/USD is from that FOMC rate decision on June 18th. While USD-strength has remained here, as well, last Friday’s swing-low was a bit higher than the FOMC inflection point, and not many other major pairs can claim that right now.
NZD/USD Daily Price Chart

Chart prepared by James Stanley; NZDUSD on Tradingview
On a shorter-term basis, price action has spent the past few hours trying to build support off of the .7000 psychological level. And just below is a Fibonacci level around .6950 that helped to build last week’s higher-low, and this would be near the bottom of the recent range, which can keep the door open for mean reversion plays.
But, for those looking to fade off USD-strength, NZD/USD can remain an attractive option.

NZD/USD Two-Hour Price Chart
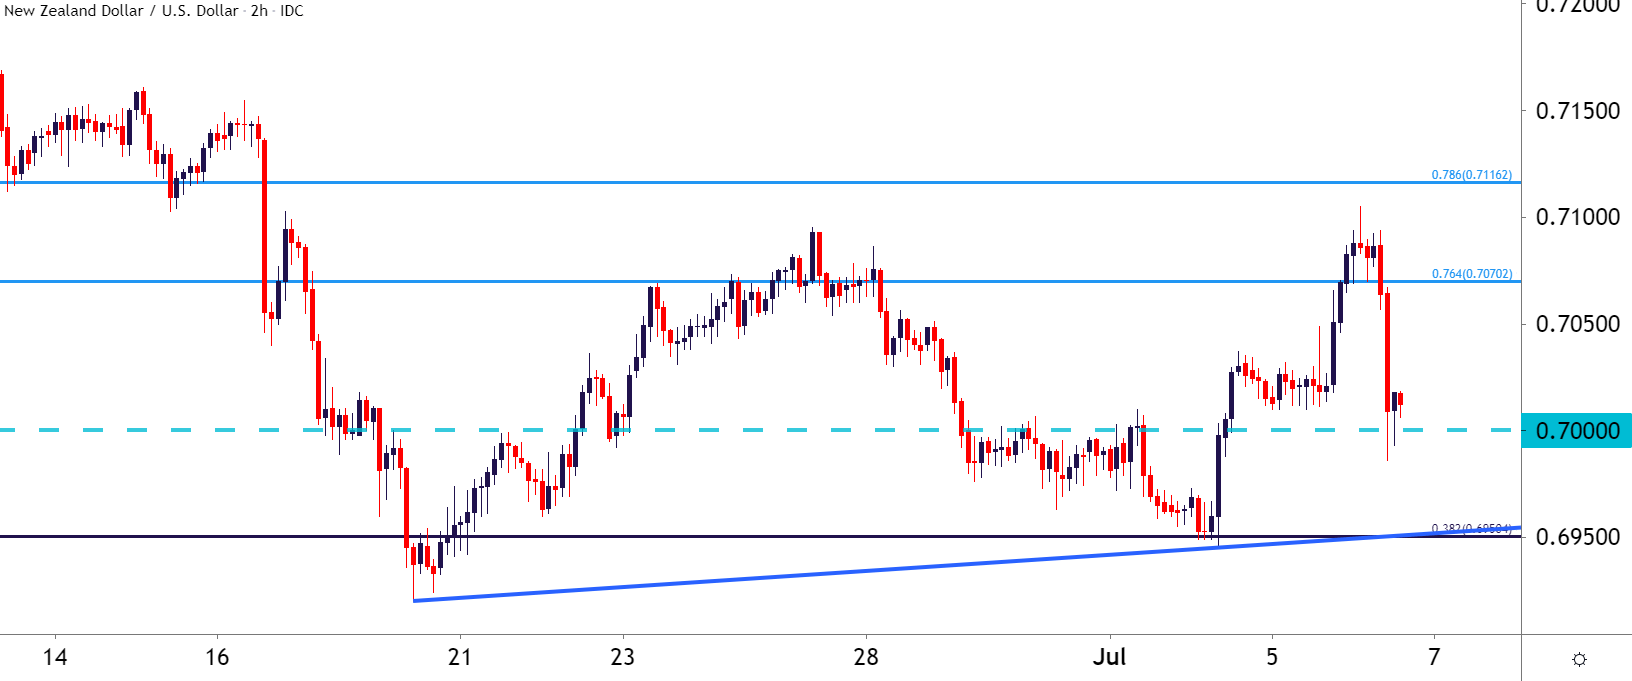
Chart prepared by James Stanley; NZDUSD on Tradingview
--- Written by James Stanley, Senior Strategist for DailyFX.com
Contact and follow James on Twitter: @JStanleyFX


