


US Dollar Talking Points:
- The US Dollar set a fresh two-month-high this morning before pulling back, driven by the Non-farm Payrolls report.
- The bullish push in USD from the FOMC rate decision in June has yet to dissipate, and this may be keeping the door open for some extension of that move as the next big FOMC items are the Jackson Hole Economic Symposium and the September FOMC rate decision, both of which take place later in the summer.
- Quarterly forecasts have just been released and if you’d like to access the Q3 Forecast for the USD, with the fundamental section authored by Chief Strategist, John Kicklighter, and the technical section authored by myself, the link below can get that set up.

Well, it looks like summer is here and not just in the weather, but in markets. There was a rush of excitement around the FOMC rate decision a couple of weeks ago and after the bullish drive in the USD, the NFP report was widely-watched for signs of strength in the US economy. And while the headline number beat, an unexpected climb in the unemployment rate buffered the excitement from the print and helped to remove a bit of pressure from the Greenback after the currency set a fresh two-month-high.
At this point, the Fed has offered only subtle signaling via the dot plot matrix, indicating a possible two rate hikes in 2023. But, given how loose monetary policy has been and just how much capital is levered on the prospect of low rates staying that way, the simple sign that this may not continue for long can be enough to provoke a shot of volatility.
For now, however, the Fed appears to be in the relative clear as they delivered their message and offered this signal without creating significant damage in risk markets. The next major FOMC outing is a little later in the summer, with the Jackson Hole Economic Symposium. And after that, the September FOMC rate decision is the next opportunity for the bank to share updated forecasts and projections, and if inflation has turned out to be more than transitory, this is likely the spot that the Federal Reserve will use to share their plans for countering that impact.
Given this backdrop, the potential for mean reversion and range-bound conditions remains high. As of this writing, the Fourth of July holiday is ahead in the United States and this will bring a lower-liquidity backdrop across many markets. Below, I look at a few setups around the US Dollar with a longer-term focus in mind, looking for themes of interest as we trade deeper into Q2.
And if you want to see more trade ideas, DailyFX has just published our Top Trades for Q3, which you can access in full from the link below:

US Dollar
The USD perched up to a fresh two-month-high on the morning of NFP. But, once the details of the report were incorporated into price action, prices fell back down towards a support spot at prior resistance. This plots around 92.46 and there’s two 23.6% Fibonacci retracements in tight proximity (one from the 2020-2021 sell-off and another from the Q1, 2021 bullish bounce). This couldn’t hold through Friday trade and prices slipped down to another spot of support, plotted around 91.19-92.26.
Sitting atop price action is some unfilled gap running up to around 92.89, and this could be an initial resistance level to follow for bullish continuation scenarios. As I shared in the webinar on Tuesday, given the combination of technical and fundamental backdrops, my near-term bias here remains bullish.
To learn more about Fibonacci, check out DailyFX Education
US Dollar Daily Price Chart
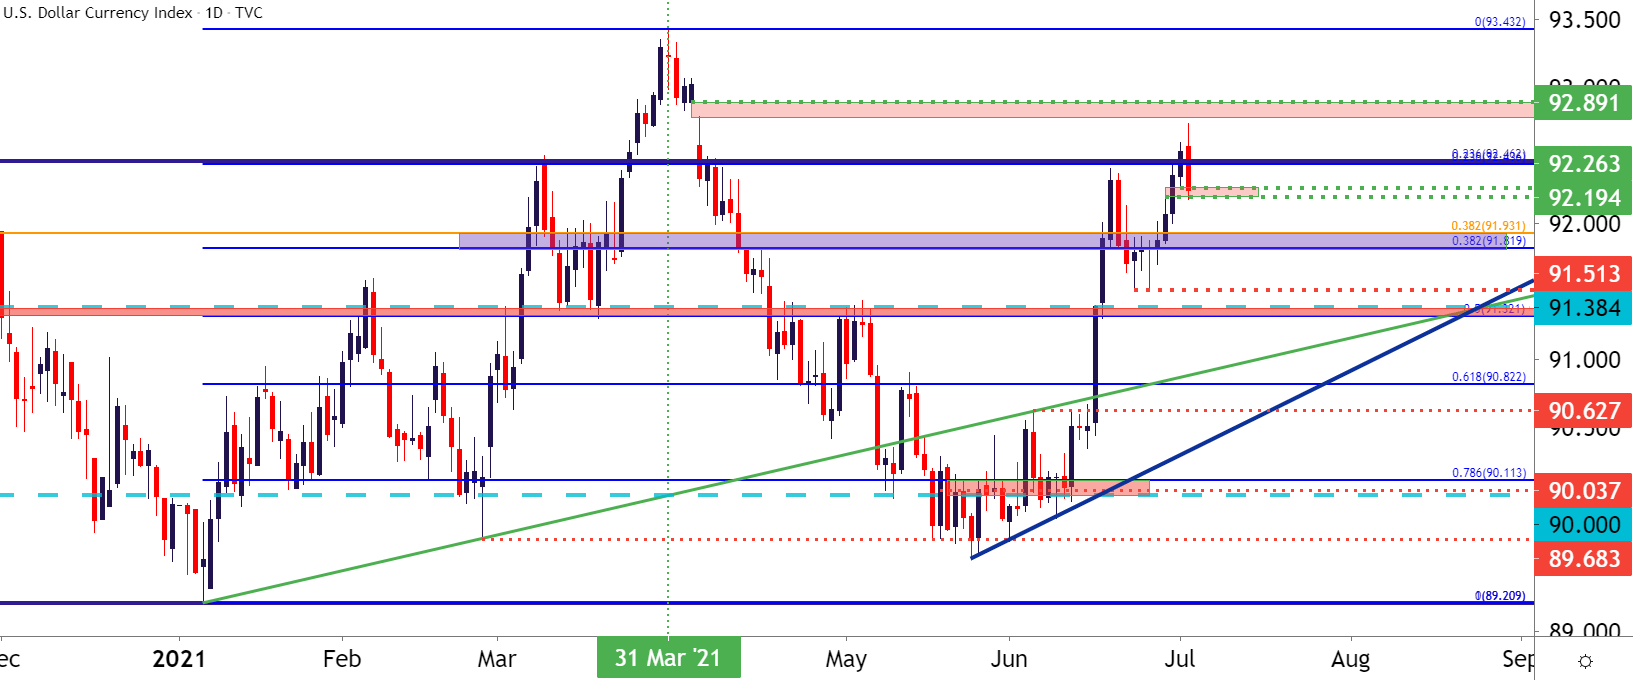
Chart prepared by James Stanley; USD, DXY on Tradingview
If the current zone of Fibonacci support cannot hold, there’s another area of possible support around 91.82-91.93. If price breaks below the double-bottom at 91.51, then the bullish theme comes into question.
US Dollar Four-Hour Price Chart

Chart prepared by James Stanley; USD, DXY on Tradingview
EUR/USD
On that topic of mean reversion, that’s basically describing the first half of 2021 in EUR/USD. After a stark sell-off in Q1 found support, Q2 saw more than 80% of that move clawed back. But after resistance played-in around 1.2250, sellers came back, helped along by that surge of USD-strength, and prices in EUR/USD started to push right back towards the support batch around the 1.1700-handle.

EUR/USD Daily Price Chart
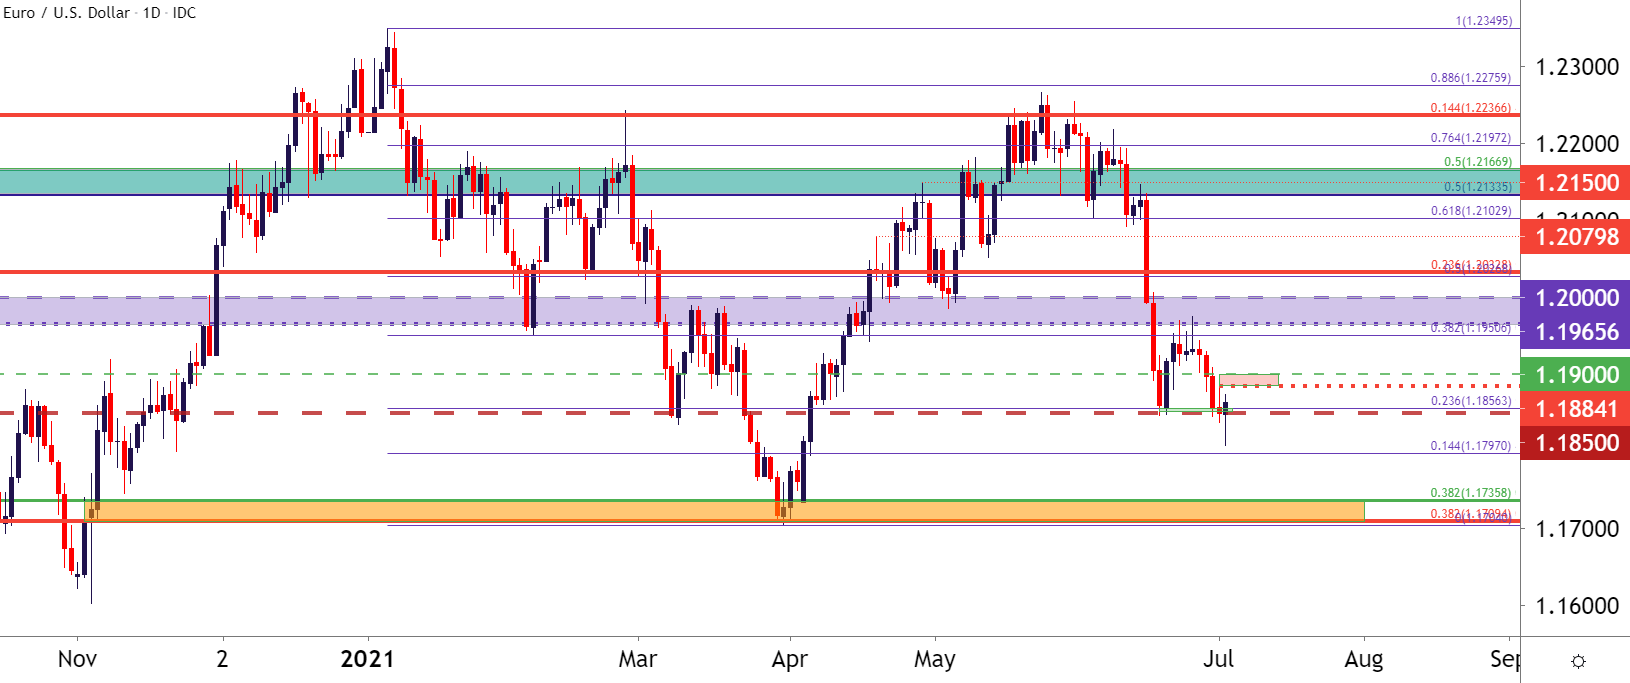
Chart prepared by James Stanley; EURUSD on Tradingview
On a shorter-term basis, this pair remains an option for USD-strength scenarios, with a similar albeit mirror image backdrop of the US Dollar. After a visit to resistance in the 1965-2000 zone, sellers were on the prowl this week to push in a fresh two-month-low in the pair. Prices crossed a big spot of prior support around the 1.1850 level, and after the Friday NFP release, prices pushed back above this spot; yet remain below the prior lower-high from around 1.1885.
A hold below the 1.1885-1.1900 zone can keep the door open for bearish scenarios in the pair, targeting a re-test of the 2021 lows which, at this point, can be classified as range support in the EUR/USD, at least until it’s broken.
EUR/USD Four-Hour Price Chart

Chart prepared by James Stanley; EURUSD on Tradingview
GBP/USD
GBP/USD remains interesting as it was one of the stronger major pairs ahead of the FOMC’s rate decision a couple weeks ago. But, as the theme of USD strength drove in the aftermath of that meeting, GBP/USD plunged down to fresh lows along with a number of other major pairs.
The big area of nearby support in GBP/USD plots from around 1.3644-1.3678. This is a confluent zone of Fibonacci retracement levels that caught support inflections in March and April of this year after helping to set resistance in January, around the yearly open. A test here can open the door for bullish setups, looking for mean reversion themes to remain.

GBP/USD Daily Price Chart
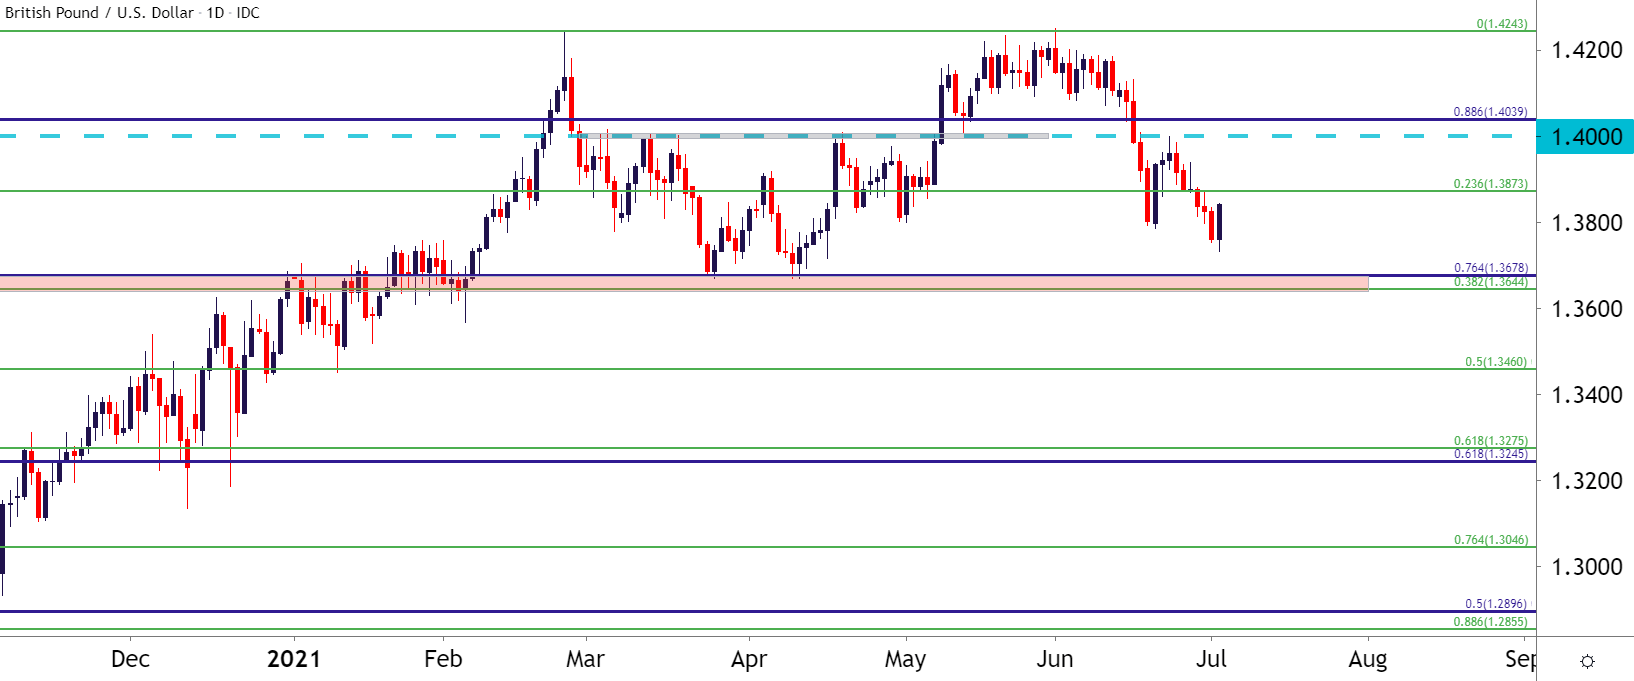
Chart prepared by James Stanley; GBPUSD on Tradingview
USD/CAD Returns to Big Support Zone
I had looked into USD/CAD earlier in the week, plotting a short-term range after a bounce from a key zone of support. But the NFP impact to the USD caused prices to breach support in the short-term range, with prices driving all the way down to the longer-term support zone plotted from 1.2250-1.2300.
This keeps the door open for bullish scenarios should this support zone hold through the open next week.

USD/CAD Four-Hour Price Chart
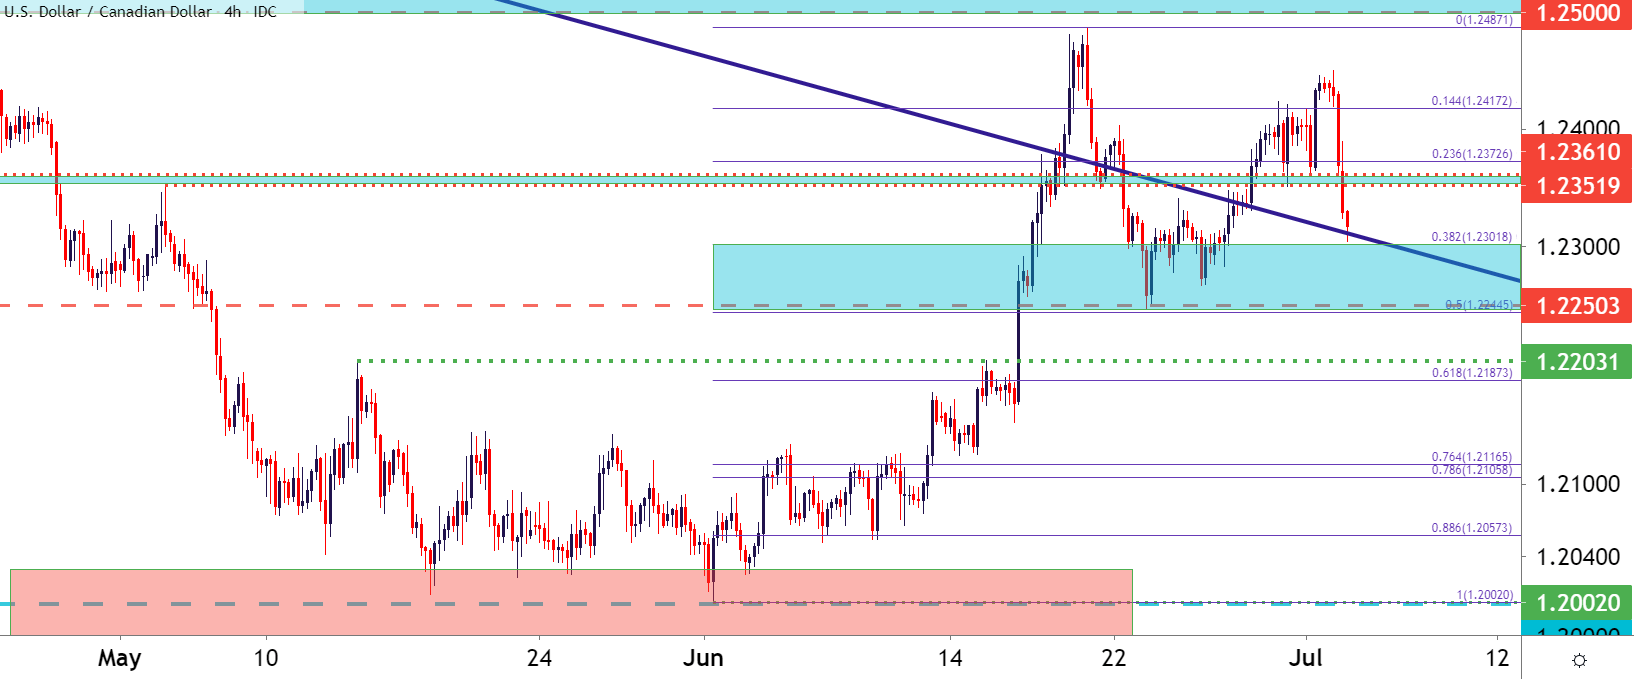
Chart prepared by James Stanley; USDCAD on Tradingview
USD/JPY Pullback to Support at Prior Resistance
Another setup that could remain amenable for near-term USD strength in USD/JPY. The pair similarly saw pullback around the NFP report, with prices quickly returning to a Fibonacci level just below the 111.00 handle. This same level had previously helped to set resistance in the pair and after the breakout ran up to another Fibonacci level earlier this week, prices have returned to that inflection point and this can keep the door open for themes of bullish continuation.

USD/JPY Four-Hour Price Chart
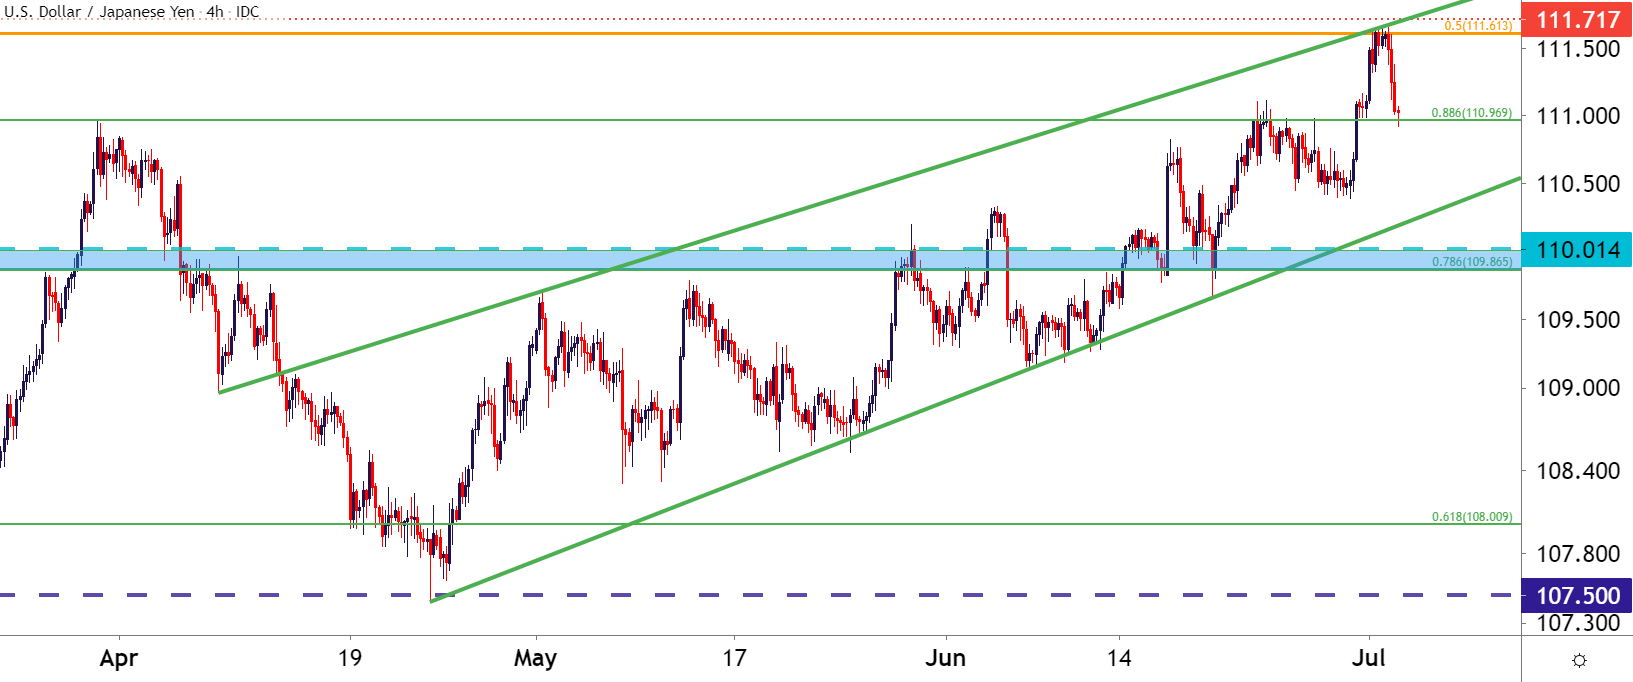
Chart prepared by James Stanley; USDJPY on Tradingview
--- Written by James Stanley, Senior Strategist for DailyFX.com
Contact and follow James on Twitter: @JStanleyFX


