


British Pound, GBP/USD, GBP/CAD, GBP/NZD, GBP/CHF – Technical Outlook
- The British Pound is struggling against the US Dollar and Canadian Dollar
- GBP/USD may clear March 2020 support, GBP/CAD eyes bearish crossover
- GBP/NZD could fall in the near-term, GBP/CHF broader view more bullish

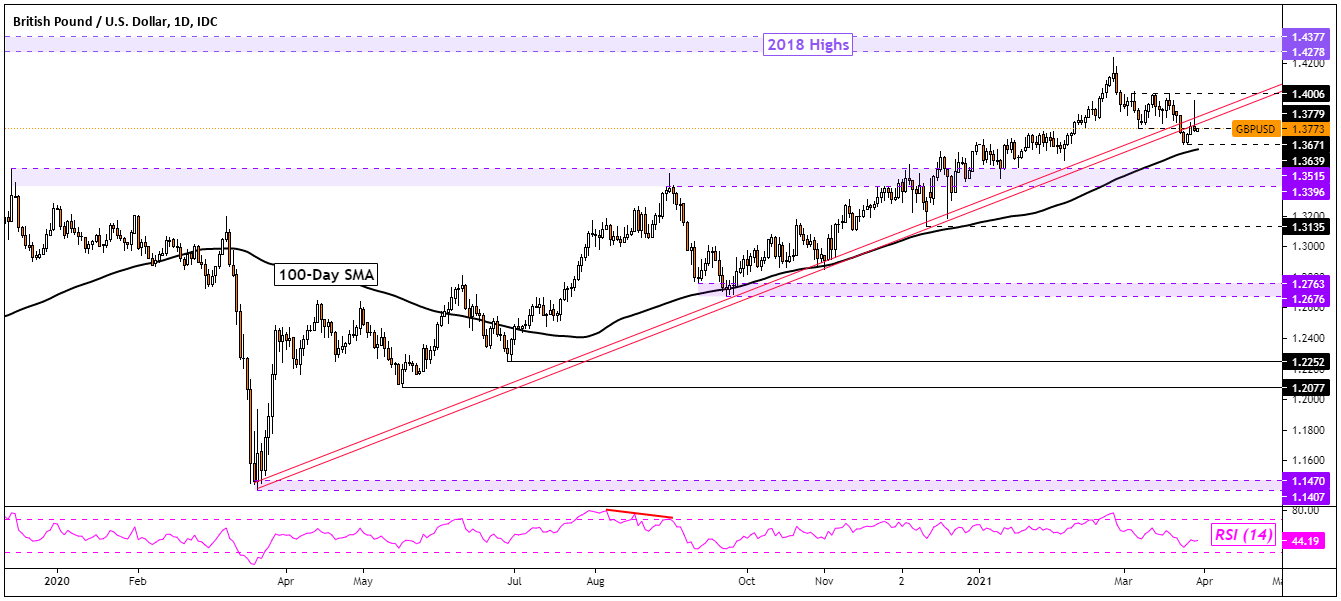
The British Pound could be vulnerable to the US Dollar in the near-term after GBP/USD broke under key rising support from March 2020. However, follow-through has been somewhat lackluster. As such, this places the focus on the 100-day Simple Moving Average to see if it holds as the next critical point of support. Taking it out would expose the 1.3515 – 1.3396 inflection zone. Otherwise, a push higher places the focus on 1.4006 followed by peaks from 2018.
GBP/USD Daily Chart
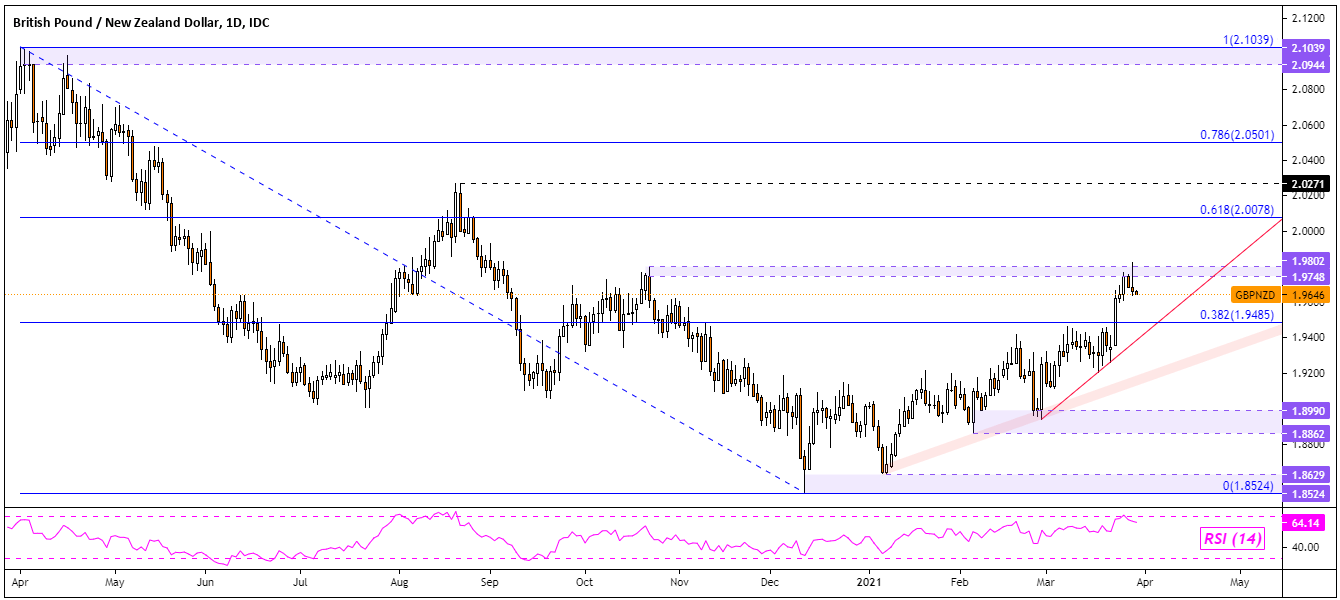
The British Pound may also be at risk to the New Zealand Dollar in the near-term after GBP/NZD rejected the 1.9748 – 1.9802 resistance zone. After a couple of confirmatory downside closes, that has placed the focus on rising support from the end of February. Beyond that is the rising range of support from the beginning of this year. While GBP/NZD may be vulnerable, these trendlines may maintain the dominant upside focus down the road. Pushing above highs from October exposes the 61.8% Fibonacci retracement at 2.0078.
GBP/NZD Daily Chart
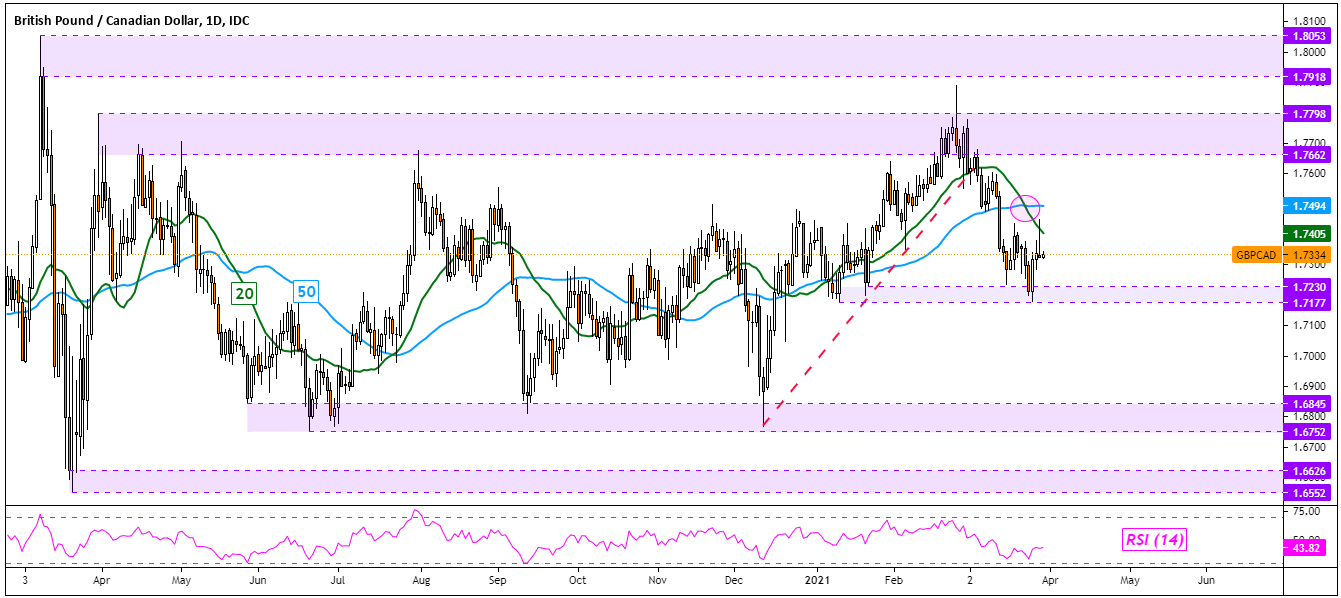
The British Pound may also be at risk to the Canadian Dollar. Recently, the 50-day SMA crossed above the 20-day one, forming a bearish Death Cross. This could see GBP/NZD fall towards the key 1.7177 – 1.7230 support zone. There, prices may bounce and face the moving averages once more for a chance to reverse the near-term downtrend since February. Otherwise, clearing the range below may pave the way to retest the 1.6752 – 1.6845 support zone.

GBP/CAD Daily Chart
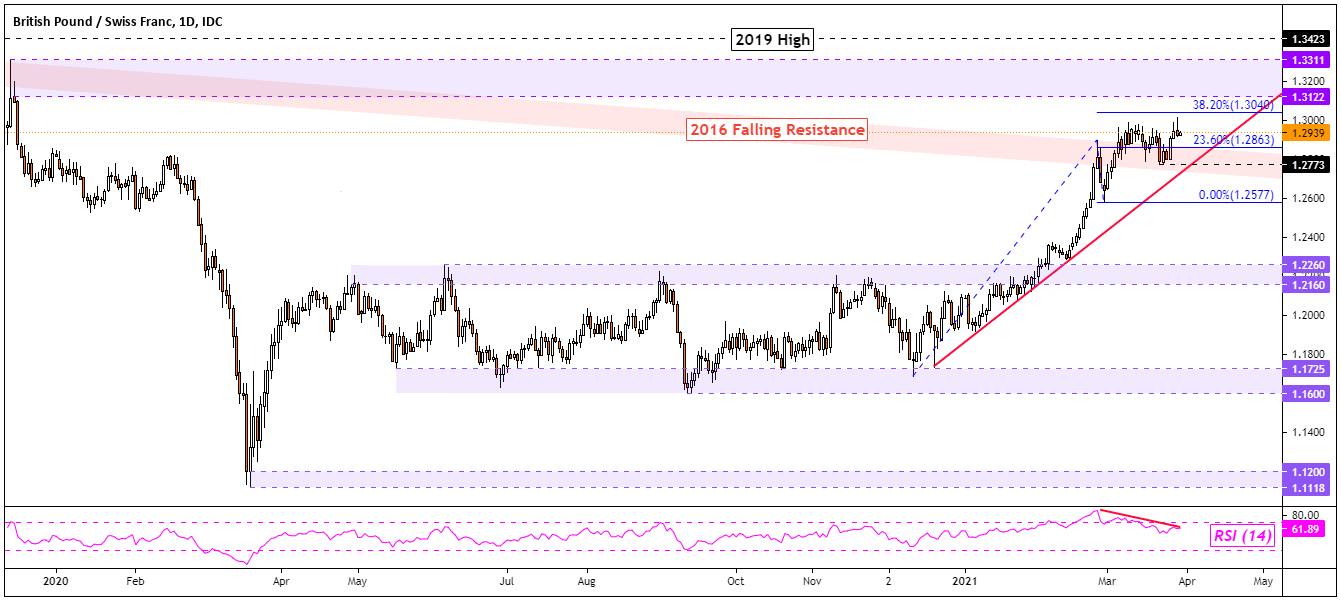
The British Pound is looking more bullish against the Swiss Franc. GBP/CHF is attempting to push above a key falling zone of resistance from 2016 – see chart below. Guiding the pair higher appears to be a rising trendline from December. As such, we may see the pair retest highs from the end of 2019 between 1.31122 and 1.3311. Beyond this fairly wide range sits the peak from 2019 at 1.3423. However, negative RSI divergence does show that upside momentum is fading. This could precede a turn lower towards support.
GBP/CHF Daily Chart
--- Written by Daniel Dubrovsky, Strategist for DailyFX.com
To contact Daniel, use the comments section below or @ddubrovskyFX on Twitter


