


USD/MXN Technical Highlights:
- USD/MXN rallying, but remains stuck in strong down-trend
- Resistance levels are seen to prove difficult to overcome
- Multi-year support is near, may keep another round of selling subdued
USD/MXN has been trying to turn it around, but a strong trend since March continues to keep it positioned lower as the reflation trade continues. Stock strength and dollar weakness remains a strong headwind for the pair.
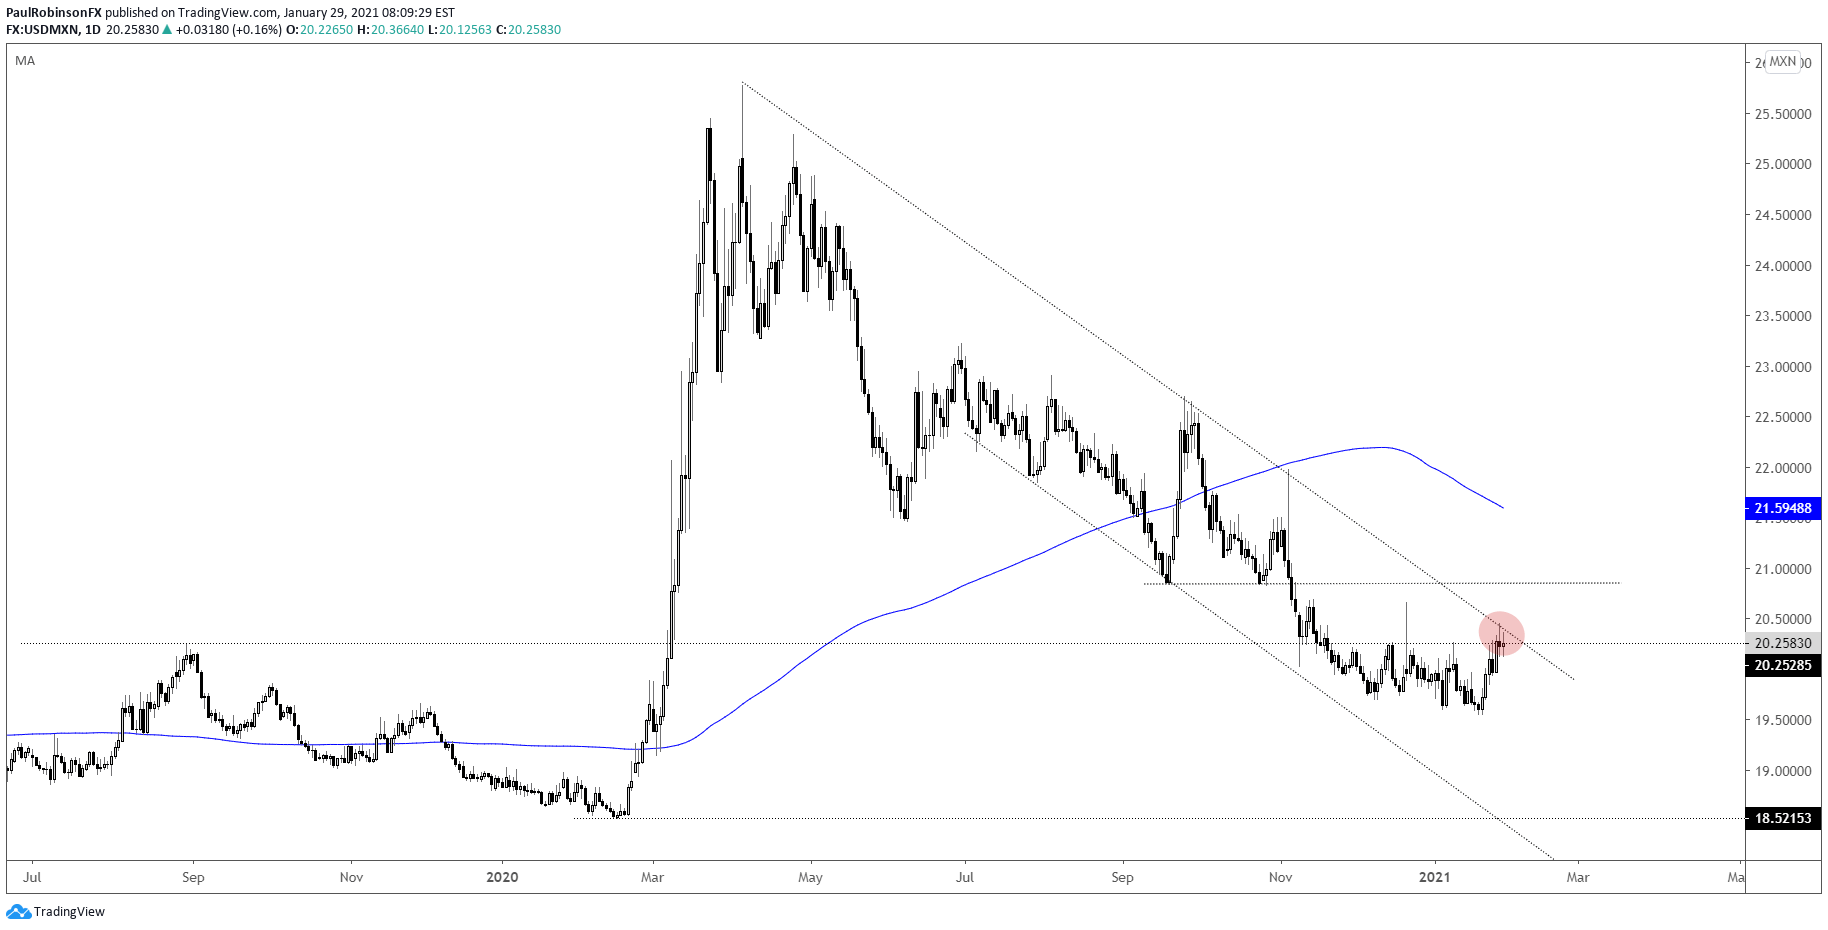
From a pure technical standpoint, there is resistance via a horizontal level dating to a peak created in the summer of 2019. The area around 20.25 has become difficult to overcome recently, with several bumps up against it resulting in near-term highs.
With time this level has become confluent with the trend-line off the March high. The combination of strong horizontal resistance and a trend-line may prove to be too much to overcome in the absence of a reversal in risk trends/USD.
With that in mind, we may have seen the best out of USD/MXN for now. Looking lower, not too far below the recent low at 19.55, lies a trend-line running up from 2014 that passes under the 2020 low. This may thwart any further downside attempt to continue the trend lower. It will certainly be of interest how price action plays out should it get tested soon.

USD/MXN Daily Chart (confluent resistance)
USD/MXN Weekly Chart (2014 trend-line)

Resources for Forex Traders
Whether you are a new or experienced trader, we have several resources available to help you; indicator for tracking trader sentiment, quarterly trading forecasts, analytical and educational webinars held daily, trading guides to help you improve trading performance, and one specifically for those who are new to forex.
---Written by Paul Robinson, Market Analyst
You can follow Paul on Twitter at @PaulRobinsonFX


