


Swiss Franc Technical Forecast – Talking Points
- Swiss Franc faces tough technical picture versus CAD and NZD
- NZD/CHF is preparing to retest long-term trendline resistance
- CAD/CHF’s recent Triangle breakout now faces Fibonacci level

NZD/CHF Technical Outlook
NZD/CHF has gained roughly 1.25% over the past two days and is approaching long-term trendline resistance stemming from the 2007 swing high. Since the 2020 March swing low, the New Zealand Dollar climbed nearly 21% against the Swiss Franc. That trendline seemed to help turn prices around earlier this month however.
That said, the resistance level looks like it may be the largest technical hurdle for Kiwi bulls to continue moving higher. A breach above would likely see momentum accelerate, giving way to a possible breakout and opening the 2019 December high to the upside. A move lower, however, would open the 78.6% Fibonacci retracement, with the 100 and 200-day Simple Moving Averages below.
NZD/CHF Daily Price Chart

Chart created with TradingView
CAD/CHF Technical Outlook
CAD/CHF broke out of a Symmetrical Triangle earlier this month. Prices quickly returned to retest the initial breakout level, with prior resistance turning into support. CAD/CHF then proceeded higher in textbook fashion, before meeting the 23.6% Fibonacci retracement from the March – June 2020 move, which contained further bullish action.
That Fib level appears to be the most prominent near-term resistance level, and the rising Relative Strength Index (RSI) and MACD oscillators indicate prices may swiftly return to test it again. To the downside, the 0.7000 psychological level and the 38.2% Fib may provide an area for CAD/CHF bulls to regroup.
CAD/CHF Daily Chart
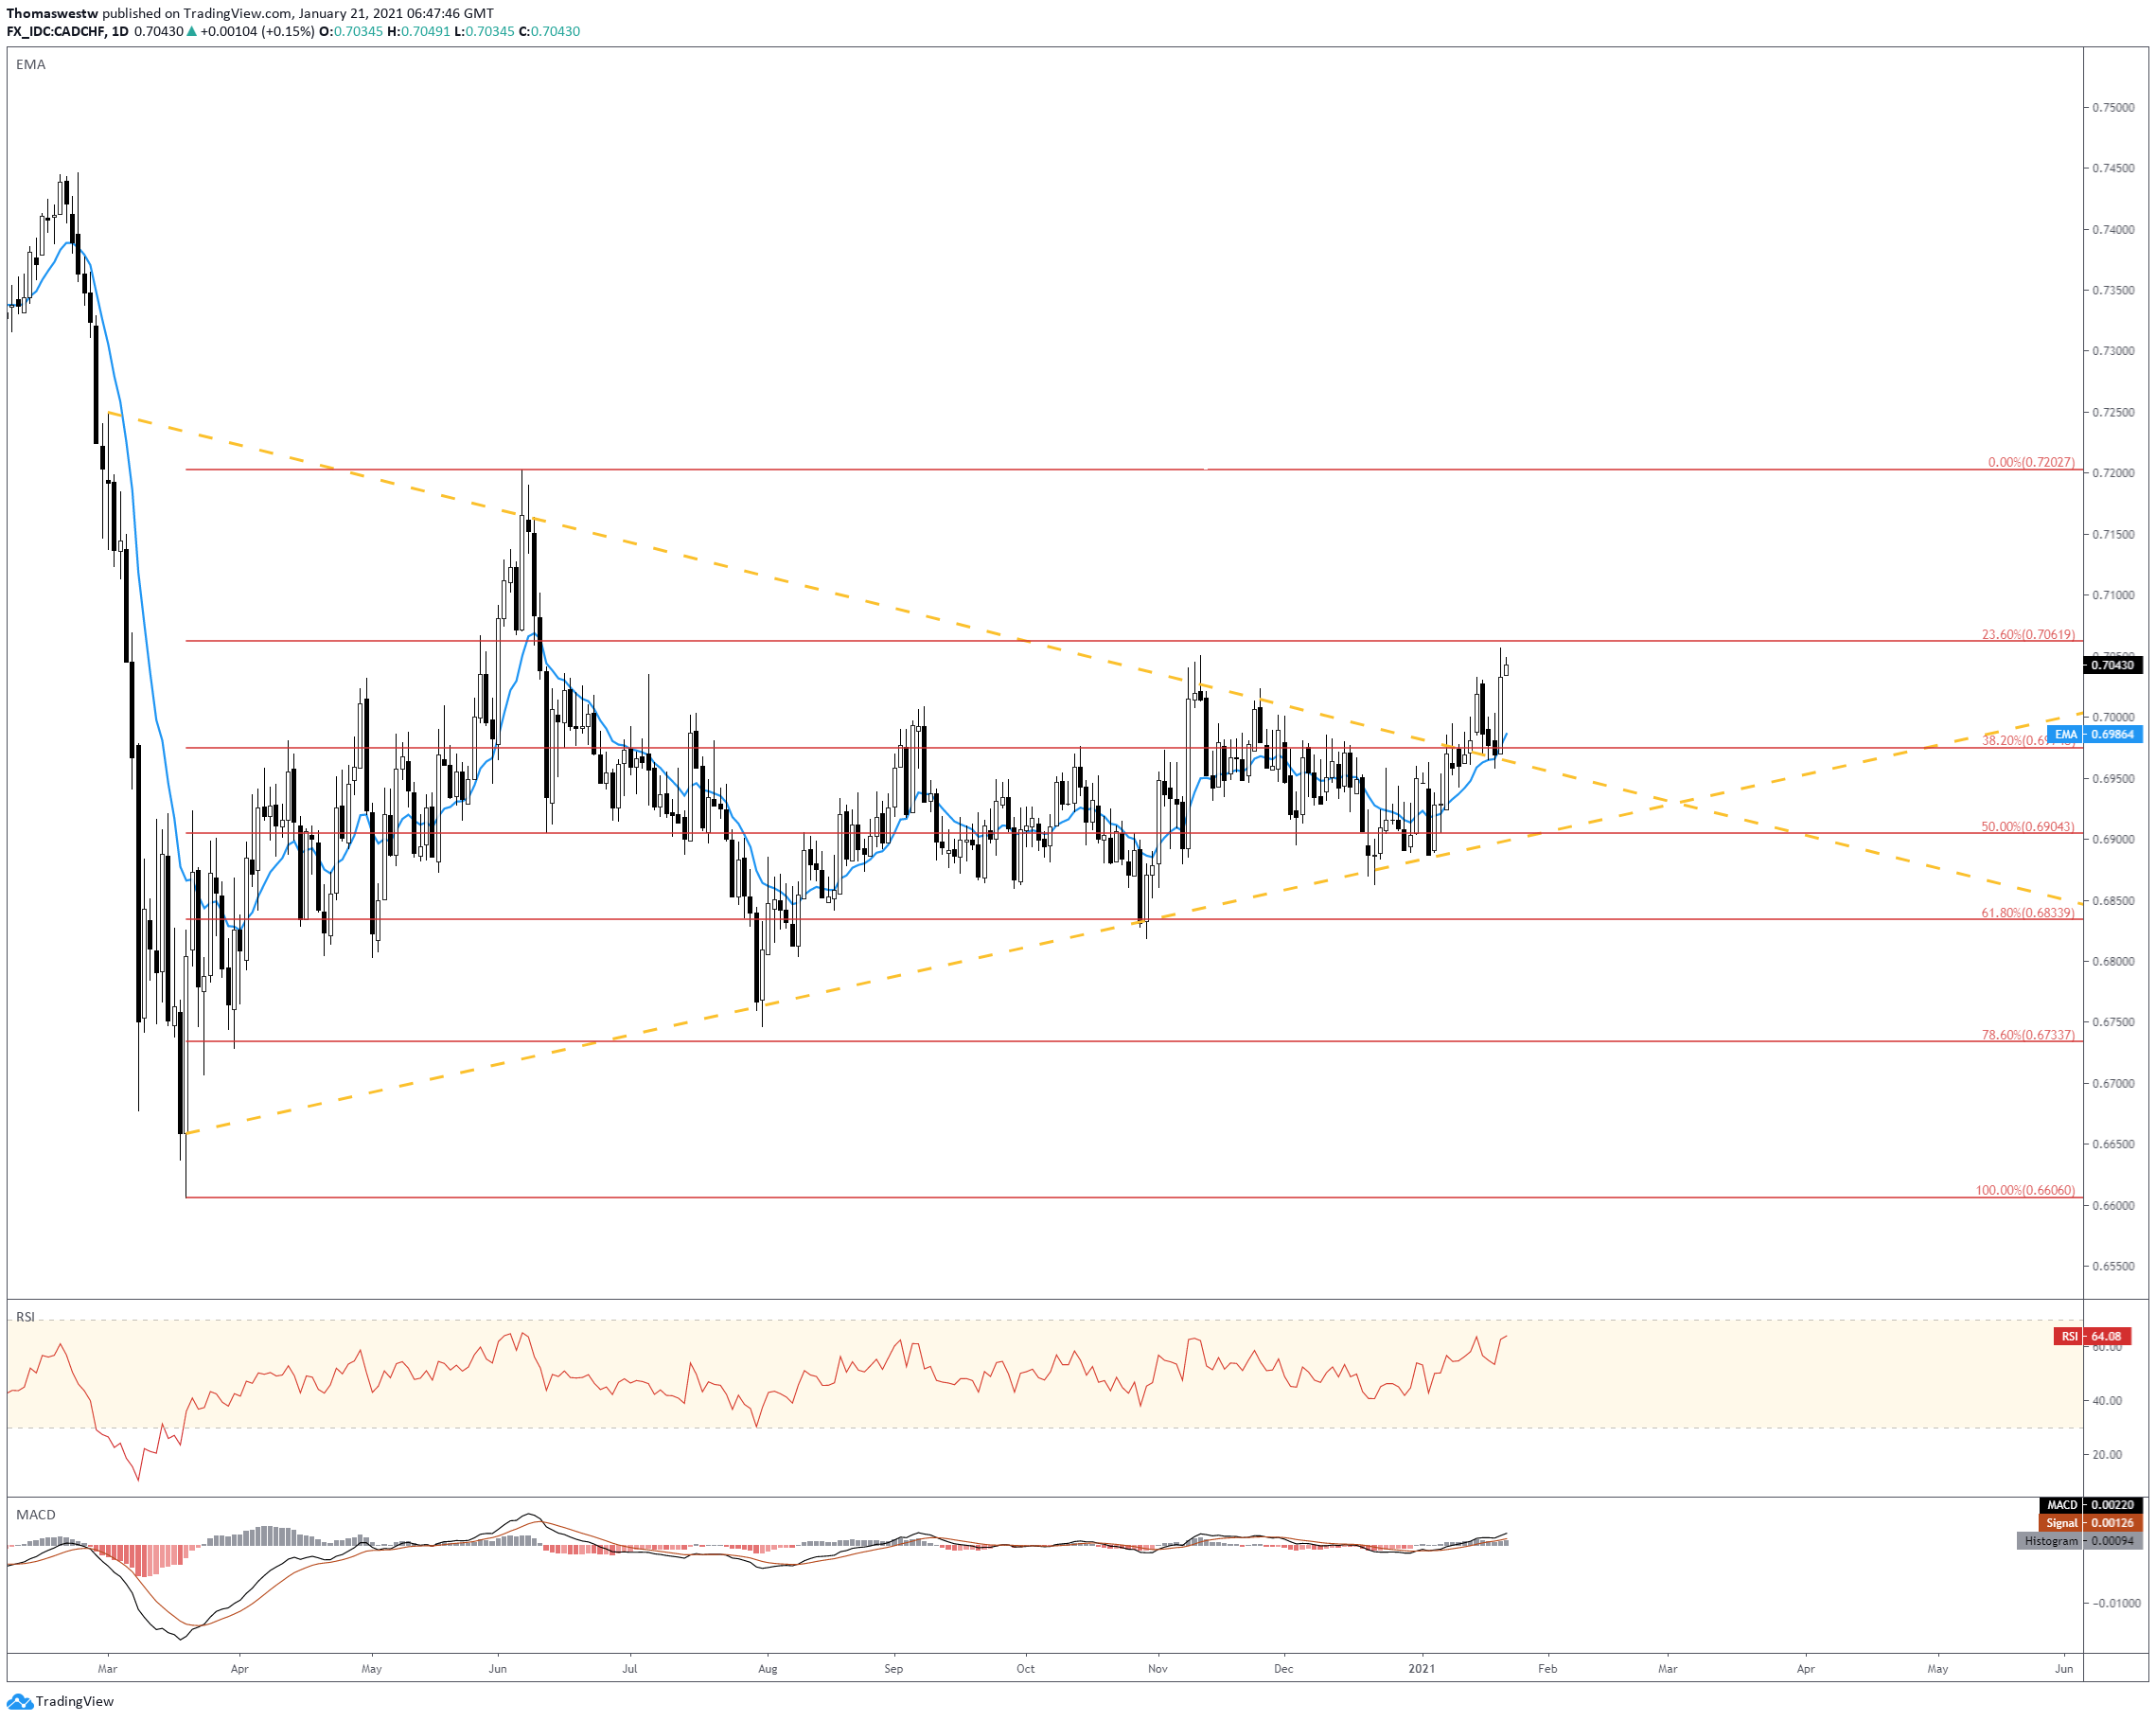
Chart created with TradingView
NZD/CHF, CAD/CHF TRADING RESOURCES
- Just getting started? See our beginners’ guide for FX traders
- What is your trading personality? Take our quiz to find out
- Join a free webinar and have your trading questions answered
--- Written by Thomas Westwater, Analyst for DailyFX.com
To contact Thomas, use the comments section below or @FxWestwater on Twitter


